🔎 Market Structure Analysis
4H Chart
Price is moving inside a rising channel, but repeatedly rejecting around 24,840–24,880 supply zone.
Recent rejection shows short-term weakness, but the structure is still holding higher-lows around 24,650–24,670 (support).
Key imbalance (FVG) visible near 24,650, which could act as a demand zone.
Bias: Sideways-to-bullish unless 24,650 is broken.
1H Chart
Price attempted a breakout above 24,840, failed, and pulled back into the 24,720–24,750 zone.
This zone coincides with channel support + minor demand.
As long as 24,700 holds, structure favors bounce continuation.
Break below 24,700 = short-term bearish with downside open to 24,560.
Bias: Neutral with bullish tilt (unless 24,700 fails).
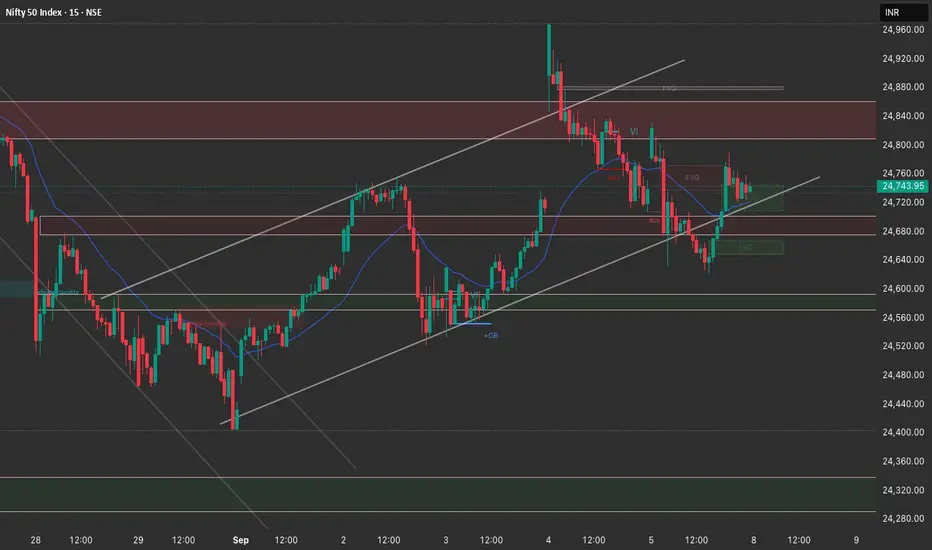
15M Chart
Micro-structure shows failed breakout → liquidity grab above 24,840, followed by BOS (break of structure) downward.
Price is consolidating just above support trendline.
Short-term buyers defending 24,700–24,720.
Bias: Expect volatility early session — direction depends on 24,700 hold/break.
📌 Trade Plan for 8th September (Monday)
Long Scenario (preferred bias)
Entry Zone: 24,700–24,720 support
Targets:
T1: 24,820
T2: 24,880 (channel high / supply)
T3: 25,000+ (if breakout holds)
Stop Loss: Below 24,650
Short Scenario (if breakdown happens)
Trigger: Break & close below 24,700 on 15M/1H
Entry Zone: 24,690–24,710 (retest entry)
Targets:
T1: 24,560
T2: 24,450
T3: 24,300 (major demand)
Stop Loss: Above 24,760
🎯 Summary
Above 24,700 → Look for longs into 24,880–25,000.
Below 24,700 → Shorts open till 24,560–24,300.
Expect whipsaws around open; best is to wait for 15M structure confirmation.
4H Chart
Price is moving inside a rising channel, but repeatedly rejecting around 24,840–24,880 supply zone.
Recent rejection shows short-term weakness, but the structure is still holding higher-lows around 24,650–24,670 (support).
Key imbalance (FVG) visible near 24,650, which could act as a demand zone.
Bias: Sideways-to-bullish unless 24,650 is broken.
1H Chart
Price attempted a breakout above 24,840, failed, and pulled back into the 24,720–24,750 zone.
This zone coincides with channel support + minor demand.
As long as 24,700 holds, structure favors bounce continuation.
Break below 24,700 = short-term bearish with downside open to 24,560.
Bias: Neutral with bullish tilt (unless 24,700 fails).
15M Chart
Micro-structure shows failed breakout → liquidity grab above 24,840, followed by BOS (break of structure) downward.
Price is consolidating just above support trendline.
Short-term buyers defending 24,700–24,720.
Bias: Expect volatility early session — direction depends on 24,700 hold/break.
📌 Trade Plan for 8th September (Monday)
Long Scenario (preferred bias)
Entry Zone: 24,700–24,720 support
Targets:
T1: 24,820
T2: 24,880 (channel high / supply)
T3: 25,000+ (if breakout holds)
Stop Loss: Below 24,650
Short Scenario (if breakdown happens)
Trigger: Break & close below 24,700 on 15M/1H
Entry Zone: 24,690–24,710 (retest entry)
Targets:
T1: 24,560
T2: 24,450
T3: 24,300 (major demand)
Stop Loss: Above 24,760
🎯 Summary
Above 24,700 → Look for longs into 24,880–25,000.
Below 24,700 → Shorts open till 24,560–24,300.
Expect whipsaws around open; best is to wait for 15M structure confirmation.
Penafian
Maklumat dan penerbitan adalah tidak dimaksudkan untuk menjadi, dan tidak membentuk, nasihat untuk kewangan, pelaburan, perdagangan dan jenis-jenis lain atau cadangan yang dibekalkan atau disahkan oleh TradingView. Baca dengan lebih lanjut di Terma Penggunaan.
Penafian
Maklumat dan penerbitan adalah tidak dimaksudkan untuk menjadi, dan tidak membentuk, nasihat untuk kewangan, pelaburan, perdagangan dan jenis-jenis lain atau cadangan yang dibekalkan atau disahkan oleh TradingView. Baca dengan lebih lanjut di Terma Penggunaan.