Nifty 50 – Immediate Trend Analysis (Hourly Chart)
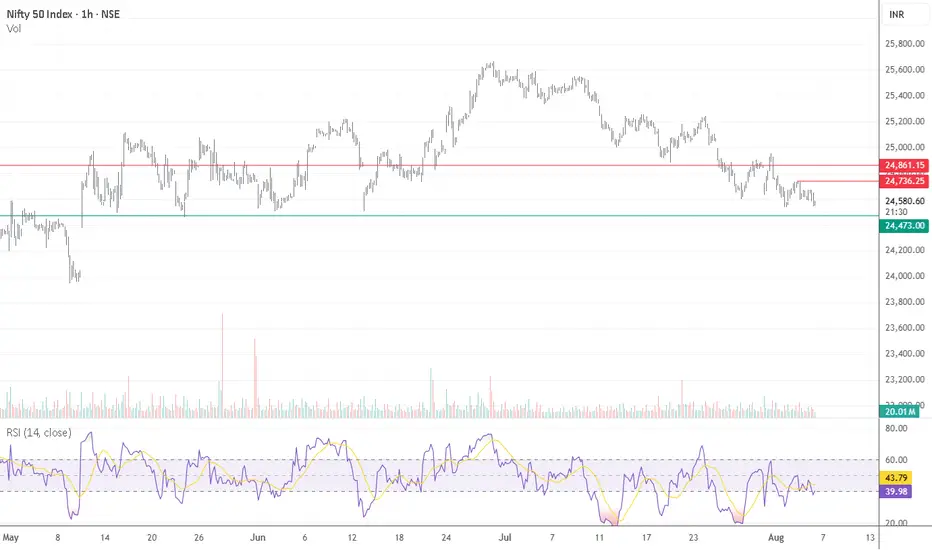
On the hourly chart, Nifty 50 is exhibiting a clear downtrend, forming a pattern of lower highs and lower lows—signaling weakness in the immediate term.
The index has now approached a crucial support zone, which held strong multiple times during May and June, leading to a notable upside reversal in the past. This makes the current level a key inflection point.
If this support level holds, a short-term bounce is likely.
However, a break below this zone could accelerate the decline, potentially taking the index quickly towards the 24,000 level.
Key Takeaway:
Monitor this support zone closely for confirmation of a bounce or a breakdown to position accordingly.
#Nifty50 #NiftyAnalysis #TechnicalAnalysis #StockMarketIndia #NiftySupport #HourlyChart #Downtrend #MarketUpdate #NSE #IndexWatch #TradingStrategy #BreakdownOrBounce #PriceAction #ChartAnalysis #NiftyLevels
Penafian
Maklumat dan penerbitan adalah tidak dimaksudkan untuk menjadi, dan tidak membentuk, nasihat untuk kewangan, pelaburan, perdagangan dan jenis-jenis lain atau cadangan yang dibekalkan atau disahkan oleh TradingView. Baca dengan lebih lanjut di Terma Penggunaan.
Penafian
Maklumat dan penerbitan adalah tidak dimaksudkan untuk menjadi, dan tidak membentuk, nasihat untuk kewangan, pelaburan, perdagangan dan jenis-jenis lain atau cadangan yang dibekalkan atau disahkan oleh TradingView. Baca dengan lebih lanjut di Terma Penggunaan.