NIFTY 50 Index (2H timeframe)
---
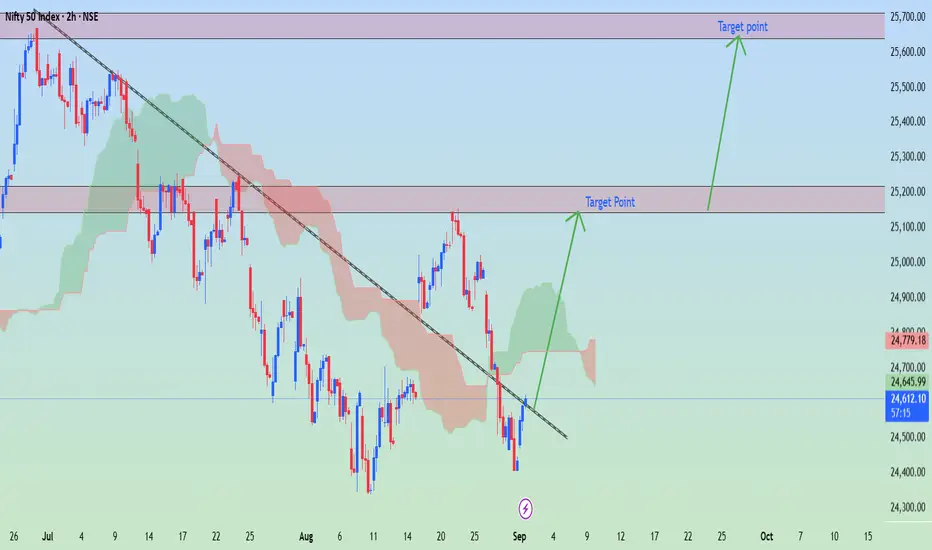
Current Market Context
Instrument: NIFTY 50 Index (NSE)
Current Price: ~24,709
Trend: Recently bounced from a support zone after a downtrend.
Indicators: Price is trying to recover above the Ichimoku cloud and has broken a short-term descending trendline.
---
Targets Marked on my Chart
1. First Target Zone: 25,150 – 25,200
This is the immediate resistance / supply zone.
Likely to be tested first on bullish continuation.
2. Second Target Zone: 25,550 – 25,600
This is the extended bullish target.
It aligns with the next major resistance zone marked in your chart.
---
Trade Idea
Entry Zone: Around 24,700 – 24,750 (current levels).
Take Profit 1: ~25,150 – 25,200.
Take Profit 2: ~25,550 – 25,600.
Stop Loss: Below recent swing low (~24,500).
---
⚠ Note: NIFTY moves strongly with global cues and India’s market data. If bulls fail to hold above 24,500, bearish pressure could resume.
---
Current Market Context
Instrument: NIFTY 50 Index (NSE)
Current Price: ~24,709
Trend: Recently bounced from a support zone after a downtrend.
Indicators: Price is trying to recover above the Ichimoku cloud and has broken a short-term descending trendline.
---
Targets Marked on my Chart
1. First Target Zone: 25,150 – 25,200
This is the immediate resistance / supply zone.
Likely to be tested first on bullish continuation.
2. Second Target Zone: 25,550 – 25,600
This is the extended bullish target.
It aligns with the next major resistance zone marked in your chart.
---
Trade Idea
Entry Zone: Around 24,700 – 24,750 (current levels).
Take Profit 1: ~25,150 – 25,200.
Take Profit 2: ~25,550 – 25,600.
Stop Loss: Below recent swing low (~24,500).
---
⚠ Note: NIFTY moves strongly with global cues and India’s market data. If bulls fail to hold above 24,500, bearish pressure could resume.
Dagangan aktif
trade active📲 Join telegram channel free ..
t.me/+yJ2-qfkocRg1NDlk
Forex, Gold & Crypto Signals with detailed analysis & get consistent results..
t.me/goldtradingpk710
Gold Signal's with proper TP & SL for high profit opportunities..
t.me/+yJ2-qfkocRg1NDlk
Forex, Gold & Crypto Signals with detailed analysis & get consistent results..
t.me/goldtradingpk710
Gold Signal's with proper TP & SL for high profit opportunities..
Penerbitan berkaitan
Penafian
Maklumat dan penerbitan adalah tidak dimaksudkan untuk menjadi, dan tidak membentuk, nasihat untuk kewangan, pelaburan, perdagangan dan jenis-jenis lain atau cadangan yang dibekalkan atau disahkan oleh TradingView. Baca dengan lebih lanjut di Terma Penggunaan.
📲 Join telegram channel free ..
t.me/+yJ2-qfkocRg1NDlk
Forex, Gold & Crypto Signals with detailed analysis & get consistent results..
t.me/goldtradingpk710
Gold Signal's with proper TP & SL for high profit opportunities..
t.me/+yJ2-qfkocRg1NDlk
Forex, Gold & Crypto Signals with detailed analysis & get consistent results..
t.me/goldtradingpk710
Gold Signal's with proper TP & SL for high profit opportunities..
Penerbitan berkaitan
Penafian
Maklumat dan penerbitan adalah tidak dimaksudkan untuk menjadi, dan tidak membentuk, nasihat untuk kewangan, pelaburan, perdagangan dan jenis-jenis lain atau cadangan yang dibekalkan atau disahkan oleh TradingView. Baca dengan lebih lanjut di Terma Penggunaan.