🔎 Market Structure Analysis – Nifty
4H Chart
Trend Context: Nifty has broken out of the falling channel and is now testing supply around 24,950 – 25,000.
Resistance Zone: 24,950 – 25,050 (today’s rejection confirms sellers active).
Support Zone: 24,650 – 24,700 (former breakout zone, now retest possible).
Bias: Neutral-to-Bullish as long as 24,650 holds. Below that, momentum weakens.
1H Chart
Price Action: Rejected from 25,000, now consolidating just above 24,850.
Support 1: 24,850 immediate (short-term demand).
Support 2: 24,700 (critical breakout level).
Resistance: 25,000 first barrier, next at 25,300.
Bias: Short-term retracement unless demand at 24,850 holds strong.
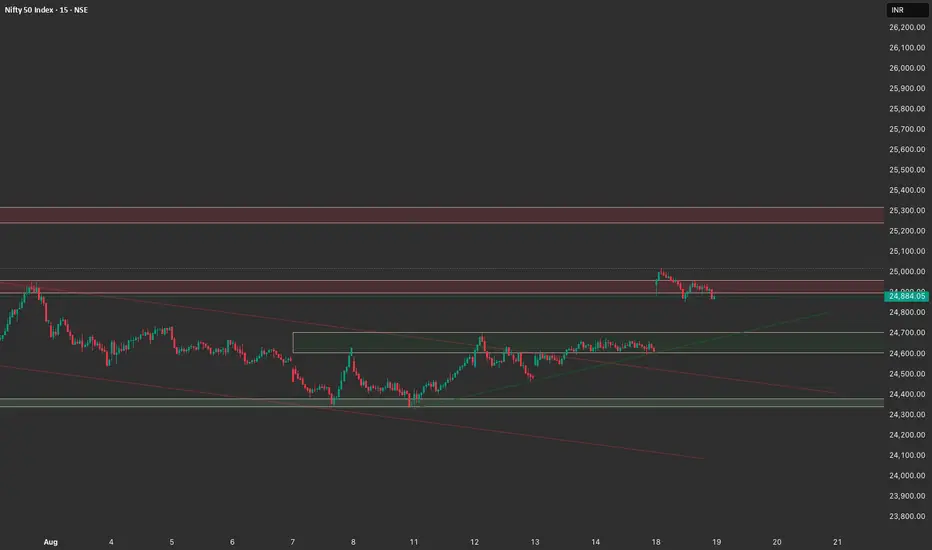
15m Chart
Intraday Flow: Breakdown from 25,000 supply, retracing towards 24,850 – 24,800.
Momentum: Sellers in control intraday, but broader trend still constructive if higher lows sustain above 24,650.
📌 Trade Plan for Tomorrow – Nifty
Long Setup (Buy side bias)
Entry Zone: 24,650 – 24,700 support retest.
Trigger: Bullish reversal candle / rejection wick near support.
Targets:
T1: 24,950 (retest of today’s high)
T2: 25,200 (next supply)
Stop Loss: Below 24,600.
Short Setup (Sell side bias)
Entry Zone: 24,950 – 25,000 supply rejection.
Trigger: Bearish engulfing / rejection candle.
Targets:
T1: 24,800
T2: 24,650
Stop Loss: Above 25,050.
🎯 Key Levels to Watch
Resistance: 25,000 → 25,300
Support: 24,850 → 24,700 → 24,400
👉 In simple terms:
If 24,650 holds, expect a bounce back towards 25,000 – 25,200.
If 24,650 breaks, sellers may drag it back to 24,400.
4H Chart
Trend Context: Nifty has broken out of the falling channel and is now testing supply around 24,950 – 25,000.
Resistance Zone: 24,950 – 25,050 (today’s rejection confirms sellers active).
Support Zone: 24,650 – 24,700 (former breakout zone, now retest possible).
Bias: Neutral-to-Bullish as long as 24,650 holds. Below that, momentum weakens.
1H Chart
Price Action: Rejected from 25,000, now consolidating just above 24,850.
Support 1: 24,850 immediate (short-term demand).
Support 2: 24,700 (critical breakout level).
Resistance: 25,000 first barrier, next at 25,300.
Bias: Short-term retracement unless demand at 24,850 holds strong.
15m Chart
Intraday Flow: Breakdown from 25,000 supply, retracing towards 24,850 – 24,800.
Momentum: Sellers in control intraday, but broader trend still constructive if higher lows sustain above 24,650.
📌 Trade Plan for Tomorrow – Nifty
Long Setup (Buy side bias)
Entry Zone: 24,650 – 24,700 support retest.
Trigger: Bullish reversal candle / rejection wick near support.
Targets:
T1: 24,950 (retest of today’s high)
T2: 25,200 (next supply)
Stop Loss: Below 24,600.
Short Setup (Sell side bias)
Entry Zone: 24,950 – 25,000 supply rejection.
Trigger: Bearish engulfing / rejection candle.
Targets:
T1: 24,800
T2: 24,650
Stop Loss: Above 25,050.
🎯 Key Levels to Watch
Resistance: 25,000 → 25,300
Support: 24,850 → 24,700 → 24,400
👉 In simple terms:
If 24,650 holds, expect a bounce back towards 25,000 – 25,200.
If 24,650 breaks, sellers may drag it back to 24,400.
Penafian
The information and publications are not meant to be, and do not constitute, financial, investment, trading, or other types of advice or recommendations supplied or endorsed by TradingView. Read more in the Terms of Use.
Penafian
The information and publications are not meant to be, and do not constitute, financial, investment, trading, or other types of advice or recommendations supplied or endorsed by TradingView. Read more in the Terms of Use.