Based on the charts and the market's performance on Tuesday, October 29, the Nifty extended its strong upward rally, closing above the critical 26,000 psychological mark. The underlying structure remains firmly bullish, despite minor profit-booking at the session's high.
Detailed Market Structure Breakdown
4-Hour Chart (Macro Trend)
Structure: The Nifty is in a Strong Bullish Momentum phase. The price is trading within a steep ascending channel, and the strong close on Tuesday (Oct 29th) has confirmed the continuation of the short-term uptrend. The market has taken out immediate liquidity and is poised to challenge the all-time high zone.
Key Levels:
Major Supply (Resistance): 26,100 - 26,200. This area is the immediate hurdle and aligns with the upper boundary of the steep channel and the recent swing high. A decisive breakout above 26,200 would open the path to the All-Time High of 26,277.
Major Demand (Support): 25,850 - 25,900. This area, which includes the lower channel trendline and the strong Order Block (OB) from the recent rally, is the must-hold zone for the short-term uptrend.
Outlook: The short-term bias is Strongly Bullish. The market has the potential to reach its all-time high soon.
1-Hour Chart (Intermediate View)
Structure: The 1H chart shows a clear continuation of structure (BOS) on the upside. The index is trading well above its key moving averages, keeping the bullish bias intact. The formation is a steep, reliable uptrend channel.
Key Levels:
Immediate Resistance: 26,100 (Upper channel resistance).
Immediate Support: 25,900 (Lower channel boundary/key support).
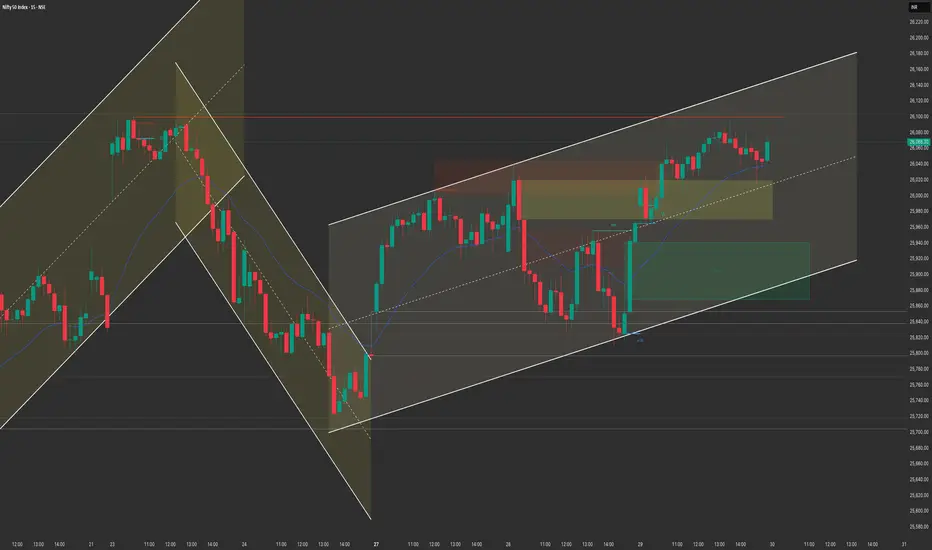
15-Minute Chart (Intraday View)
Structure: The 15M chart confirms a high-momentum close. The price has been making higher highs and higher lows within the ascending channel. The momentum indicators remain supportive of further upside.
Key Levels:
Intraday Supply: 26,100 (Intraday high target).
Intraday Demand: 25,960 (Recent consolidation support).
Outlook: Aggressively Bullish.
📈 Structure Analysis & Trade Plan: 30th October
Market Outlook: The Nifty is bullish and poised to challenge the All-Time High, with strong support at 25,900. The US Fed decision is a key global event today, which may introduce volatility.
Bullish Scenario (Primary Plan: Continuation/Breakout)
Justification: The strong technical structure and close above 26,000 favor continuation.
Entry: Long entry on a decisive break and 15-minute candle close above 26,100. Alternatively, look for a dip entry near 25,900 - 25,940 (the key support zone).
Stop Loss (SL): Place a stop loss below 25,850 (below the immediate major support).
Targets:
T1: 26,180 (Geojit target/Extension).
T2: 26,277 (All-Time High).
T3: 26,300 (Major supply/resistance band).
Bearish Scenario (Counter-Trend/Reversal)
Justification: Only valid if the rally fails dramatically, possibly due to a hawkish Fed statement or strong profit-booking.
Trigger: A sustained break and 1-hour close back below 25,850 (breaking the channel support).
Entry: Short entry below 25,850.
Stop Loss (SL): Above 26,000.
Targets:
T1: 25,700 (Major support/FVG).
T2: 25,600 (Strong weekly support).
Key Levels for Observation:
Immediate Decision Point: 25,900 - 26,100 zone.
Bullish Confirmation: Sustained trade above 26,100.
Bearish Warning: A move below 25,900.
Line in the Sand: 25,850. Below this level, the short-term bullish bias is nullified.
Crucial Event: US Federal Reserve policy meeting outcome (post-market hours, will affect volatility).
Detailed Market Structure Breakdown
4-Hour Chart (Macro Trend)
Structure: The Nifty is in a Strong Bullish Momentum phase. The price is trading within a steep ascending channel, and the strong close on Tuesday (Oct 29th) has confirmed the continuation of the short-term uptrend. The market has taken out immediate liquidity and is poised to challenge the all-time high zone.
Key Levels:
Major Supply (Resistance): 26,100 - 26,200. This area is the immediate hurdle and aligns with the upper boundary of the steep channel and the recent swing high. A decisive breakout above 26,200 would open the path to the All-Time High of 26,277.
Major Demand (Support): 25,850 - 25,900. This area, which includes the lower channel trendline and the strong Order Block (OB) from the recent rally, is the must-hold zone for the short-term uptrend.
Outlook: The short-term bias is Strongly Bullish. The market has the potential to reach its all-time high soon.
1-Hour Chart (Intermediate View)
Structure: The 1H chart shows a clear continuation of structure (BOS) on the upside. The index is trading well above its key moving averages, keeping the bullish bias intact. The formation is a steep, reliable uptrend channel.
Key Levels:
Immediate Resistance: 26,100 (Upper channel resistance).
Immediate Support: 25,900 (Lower channel boundary/key support).
15-Minute Chart (Intraday View)
Structure: The 15M chart confirms a high-momentum close. The price has been making higher highs and higher lows within the ascending channel. The momentum indicators remain supportive of further upside.
Key Levels:
Intraday Supply: 26,100 (Intraday high target).
Intraday Demand: 25,960 (Recent consolidation support).
Outlook: Aggressively Bullish.
📈 Structure Analysis & Trade Plan: 30th October
Market Outlook: The Nifty is bullish and poised to challenge the All-Time High, with strong support at 25,900. The US Fed decision is a key global event today, which may introduce volatility.
Bullish Scenario (Primary Plan: Continuation/Breakout)
Justification: The strong technical structure and close above 26,000 favor continuation.
Entry: Long entry on a decisive break and 15-minute candle close above 26,100. Alternatively, look for a dip entry near 25,900 - 25,940 (the key support zone).
Stop Loss (SL): Place a stop loss below 25,850 (below the immediate major support).
Targets:
T1: 26,180 (Geojit target/Extension).
T2: 26,277 (All-Time High).
T3: 26,300 (Major supply/resistance band).
Bearish Scenario (Counter-Trend/Reversal)
Justification: Only valid if the rally fails dramatically, possibly due to a hawkish Fed statement or strong profit-booking.
Trigger: A sustained break and 1-hour close back below 25,850 (breaking the channel support).
Entry: Short entry below 25,850.
Stop Loss (SL): Above 26,000.
Targets:
T1: 25,700 (Major support/FVG).
T2: 25,600 (Strong weekly support).
Key Levels for Observation:
Immediate Decision Point: 25,900 - 26,100 zone.
Bullish Confirmation: Sustained trade above 26,100.
Bearish Warning: A move below 25,900.
Line in the Sand: 25,850. Below this level, the short-term bullish bias is nullified.
Crucial Event: US Federal Reserve policy meeting outcome (post-market hours, will affect volatility).
Penafian
Maklumat dan penerbitan adalah tidak bertujuan, dan tidak membentuk, nasihat atau cadangan kewangan, pelaburan, dagangan atau jenis lain yang diberikan atau disahkan oleh TradingView. Baca lebih dalam Terma Penggunaan.
Penafian
Maklumat dan penerbitan adalah tidak bertujuan, dan tidak membentuk, nasihat atau cadangan kewangan, pelaburan, dagangan atau jenis lain yang diberikan atau disahkan oleh TradingView. Baca lebih dalam Terma Penggunaan.