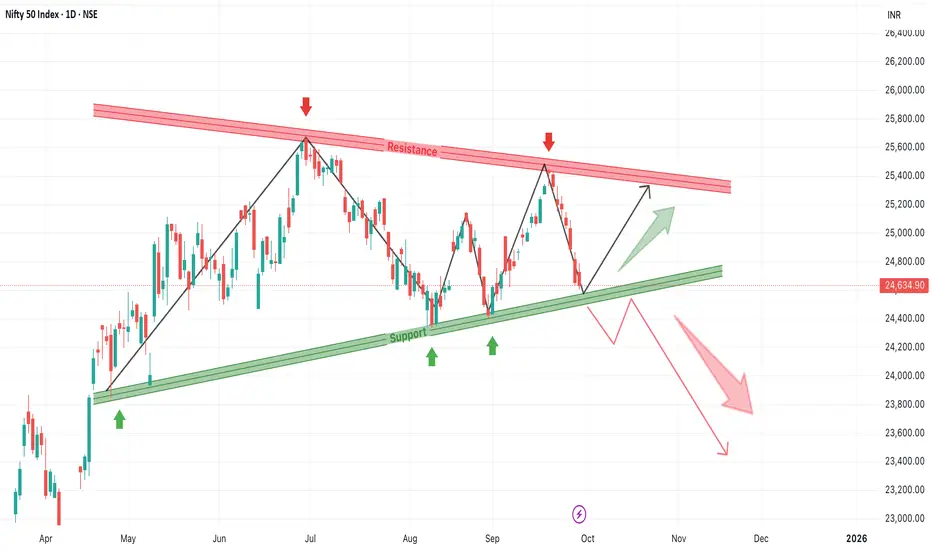
The daily chart of Nifty 50 shows a well-formed symmetrical triangle pattern. Price is currently hovering around the lower ascending trendline, which has acted as a strong support multiple times in the past. Market participants should closely monitor this zone as the next move will set the tone for October.
1. Symmetrical Triangle with Tightening Range
Nifty has been forming lower highs and higher lows since May, leading to the development of a large symmetrical triangle pattern. The converging trendlines indicate that volatility compression is taking place, often a precursor to a big breakout or breakdown move.
2. Support Zone Holding Around 24,600
Currently, the index is testing the crucial ascending support line, which has been respected at least 4 times in recent months (as shown by green arrows). A bounce from here would indicate continued buyer interest and maintain the bullish structure intact.
3. Upside Scenario – Reversal from Support
If Nifty manages to hold above this support zone and begins a reversal, we can expect a relief rally toward the falling resistance trendline. This could lead to a price retest near 25,300–25,400, which is also the previous swing high. A clean breakout above this zone could trigger a new upward trend.
4. Downside Scenario – Breakdown Below Support
On the contrary, if price breaks and closes below the 24,600 support zone, it may trigger panic selling. The chart indicates a large red arrow projection in this case, suggesting a move toward the 23,800–23,400 zone initially. A breakdown from symmetrical triangles often results in sharp directional moves.
5. Risk Management Is Critical
At this stage, traders must stay non-directional and reactive rather than anticipatory. Wait for either a confirmation bounce from support or a clear breakdown. False moves are common near the apex of a triangle. Risk should be tightly managed with stop-losses below support for long positions, and above resistance for short positions.
6. Pattern Psychology – Buyers vs Sellers at War
This pattern is a classic indecision structure, where neither bulls nor bears are in full control. The resolution from this zone will reflect market sentiment for Q4 2025. Keep an eye on macro triggers, earnings season, or global cues, which could act as catalysts for the next breakout or breakdown.
📈 Trade Smarter with TradZoo!
📣 Telegram: t.me/tradzooIndex
📣 Forex Telegram: t.me/tradzoofx
📲 Mobile App: tradzoo.com/download
📲 Forex App:tradzoo.com/forex/download
🔗 Website: bit.ly/tradzoopage
📣 Telegram: t.me/tradzooIndex
📣 Forex Telegram: t.me/tradzoofx
📲 Mobile App: tradzoo.com/download
📲 Forex App:tradzoo.com/forex/download
🔗 Website: bit.ly/tradzoopage
Penafian
Maklumat dan penerbitan adalah tidak dimaksudkan untuk menjadi, dan tidak membentuk, nasihat untuk kewangan, pelaburan, perdagangan dan jenis-jenis lain atau cadangan yang dibekalkan atau disahkan oleh TradingView. Baca dengan lebih lanjut di Terma Penggunaan.