On daily time frame Nifty is in a sideways trend now. And at present SGX nifty is almost 40-points negative compared to yesterday’s closing. And in between a support and a resistance zone. So, if SGX nifty respects any of the zones then for Monday we may see a flat opening, but failing to respect either zone by SGX Nifty, there may be a huge gap up or gap down opening in Nifty.
Now if we see Nifty in daily time frame it formed an inside candle for consecutive second day, which made our trading decision little easier. We have to marked the top and bottom of yesterday’s candle and may enter into a trade once it breaks either direction.
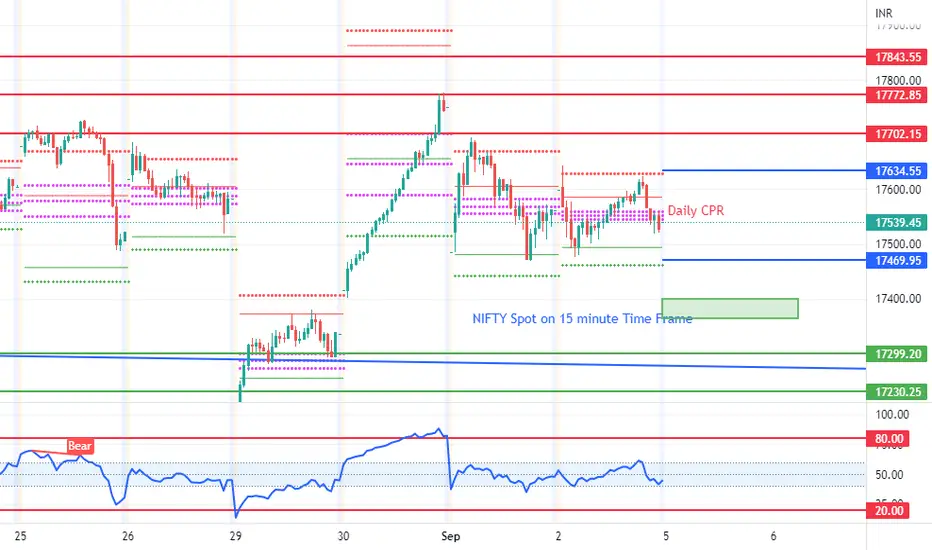
Now in 15-minute time frame- we have marked these two levels in colour blue at 17634 and 17469, if Nifty opens in between this zone, we will enter when Nifty crosses either side. For down trend, a range between 17398 to 17363, 17299 and 17230 will act as important support levels. Similarly for upside move, 17702, 17772 and 17843 will act as major resistance levels. In between 17634 and 17469 we may avoid a directional trading, but if Nifty took support or resistance at either side, we may plan to go for a short strangle, opening one leg at a time.
Now, for opening up to 17772 level we will plan for a bearish reversal, but above this level, we will plan only for bullish trade. Again in down side, we will plan for bullish trade only near 17299 support level.
Now if we see the OI chart, in CE side from 17600 to 18000 huge OI is present in each side, and in PE side, 17500 has some amount of OI followed by 17300, which indicates a bearishness in the market.
Below are some important CPR levels for tomorrow
Daily Central Pivot Range from 17560 to 17546
Weekly Central Pivot Range from 17516 to 17471
Monthly Central Pivot Range from 17697 to 17573
*All support and resistance plotted are based on PDH/PDL. For any reversal after breaking PDH/PDL, support and resistance levels will be different*
**Time of plotting the levels and planning 3rd September, 1:30 PM**
***Personal opinion, not a trading advice***
#NIFTY50
Now if we see Nifty in daily time frame it formed an inside candle for consecutive second day, which made our trading decision little easier. We have to marked the top and bottom of yesterday’s candle and may enter into a trade once it breaks either direction.
Now in 15-minute time frame- we have marked these two levels in colour blue at 17634 and 17469, if Nifty opens in between this zone, we will enter when Nifty crosses either side. For down trend, a range between 17398 to 17363, 17299 and 17230 will act as important support levels. Similarly for upside move, 17702, 17772 and 17843 will act as major resistance levels. In between 17634 and 17469 we may avoid a directional trading, but if Nifty took support or resistance at either side, we may plan to go for a short strangle, opening one leg at a time.
Now, for opening up to 17772 level we will plan for a bearish reversal, but above this level, we will plan only for bullish trade. Again in down side, we will plan for bullish trade only near 17299 support level.
Now if we see the OI chart, in CE side from 17600 to 18000 huge OI is present in each side, and in PE side, 17500 has some amount of OI followed by 17300, which indicates a bearishness in the market.
Below are some important CPR levels for tomorrow
Daily Central Pivot Range from 17560 to 17546
Weekly Central Pivot Range from 17516 to 17471
Monthly Central Pivot Range from 17697 to 17573
*All support and resistance plotted are based on PDH/PDL. For any reversal after breaking PDH/PDL, support and resistance levels will be different*
**Time of plotting the levels and planning 3rd September, 1:30 PM**
***Personal opinion, not a trading advice***
#NIFTY50
Penafian
Maklumat dan penerbitan adalah tidak dimaksudkan untuk menjadi, dan tidak membentuk, nasihat untuk kewangan, pelaburan, perdagangan dan jenis-jenis lain atau cadangan yang dibekalkan atau disahkan oleh TradingView. Baca dengan lebih lanjut di Terma Penggunaan.
Penafian
Maklumat dan penerbitan adalah tidak dimaksudkan untuk menjadi, dan tidak membentuk, nasihat untuk kewangan, pelaburan, perdagangan dan jenis-jenis lain atau cadangan yang dibekalkan atau disahkan oleh TradingView. Baca dengan lebih lanjut di Terma Penggunaan.