When markets move sharply up or down, many traders often wonder “Where should I enter?” or “Where might a reversal happen?” — That’s where Demand and Supply zones become your best trading friends. Let’s decode this chart and see how you can trade Nifty smartly using this powerful concept.
🔎 A Smart Trader's Guide to Spotting High-Probability Reversals
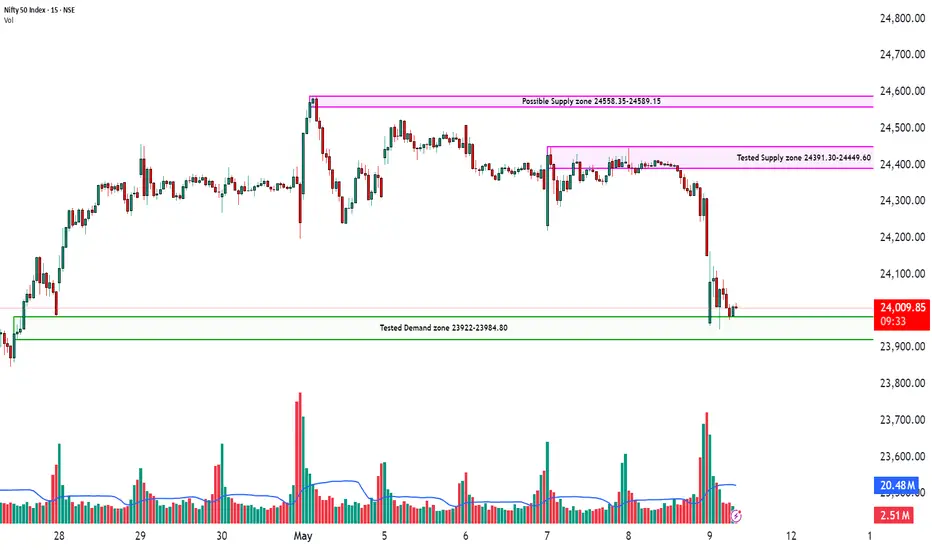
📍 Chart Timeframe: 15-Min | Index: Nifty 50
🖼️ Visuals Above: Key Demand & Supply Zones plotted with high-precision, backed by volume spikes and price rejection patterns.
🔍 What Are Demand & Supply Zones?
Think of demand and supply zones as institutional footprints.
Demand Zone = Where smart money is likely buying.
Supply Zone = Where smart money is likely selling.
These zones aren't random. They're created when large orders enter the market — and price reacts sharply. The idea is to follow where the "big boys" are placing their bets.
🧠 Why This Chart Matters:
In this Nifty 15-min chart, we’ve identified 3 key levels:
🟩 Tested Demand Zone: 23922 – 23984.80
This zone has already been tested and respected multiple times.
Price bounced cleanly from here again, showing active buying interest.
Volume confirms buyer presence — a sign that this zone still holds value.
🟥 Tested Supply Zone: 24391.30 – 24449.60
Sellers have defended this level previously.
It acted as a ceiling, pushing price back down.
If price returns here, be alert for shorting opportunities with bearish confirmation.
🟪 Possible Supply Zone (Untested): 24558.35 – 24589.15
This zone hasn’t been tested yet.
If price breaks above the first supply zone, this could be the next target or reversal point.
📈 How to Trade This Setup:
🟢 Long Trade Idea – Buy from Demand Zone
Entry: Near 23922–23984 (once price shows reversal candles or bullish volume)
Stop Loss: Just below 23922
Target: 24391–24449 (tested supply zone)
🔴 Short Trade Idea – Sell from Supply Zone
Entry: Near 24391–24449 (look for rejection wicks, volume drop)
Stop Loss: Slightly above 24449
Target: Demand zone near 23984
🔄 Breakout Opportunity
If price breaks above the tested supply zone with volume, watch for a quick move to the next supply zone near 24589.
Re-entry is possible on a retest of the broken zone.
🎯 Pro Trader Tip:
"Don’t chase price. Let it come to your zone. The highest probability trades happen when price enters a zone + confirms with volume."
⚠️ Disclaimer:
This analysis is for educational purposes only and does not constitute any investment advice or stock recommendation. Please consult with your financial advisor before taking any trading decisions. This post complies with SEBI regulations and is intended to promote financial literacy.
🗣️ Let's Discuss:
✅ Are you using supply & demand in your trading?
✅ Want help identifying zones on your favorite stocks?
👇 Drop your charts or questions in the comments — let’s grow together!
🔎 A Smart Trader's Guide to Spotting High-Probability Reversals
📍 Chart Timeframe: 15-Min | Index: Nifty 50
🖼️ Visuals Above: Key Demand & Supply Zones plotted with high-precision, backed by volume spikes and price rejection patterns.
🔍 What Are Demand & Supply Zones?
Think of demand and supply zones as institutional footprints.
Demand Zone = Where smart money is likely buying.
Supply Zone = Where smart money is likely selling.
These zones aren't random. They're created when large orders enter the market — and price reacts sharply. The idea is to follow where the "big boys" are placing their bets.
🧠 Why This Chart Matters:
In this Nifty 15-min chart, we’ve identified 3 key levels:
🟩 Tested Demand Zone: 23922 – 23984.80
This zone has already been tested and respected multiple times.
Price bounced cleanly from here again, showing active buying interest.
Volume confirms buyer presence — a sign that this zone still holds value.
🟥 Tested Supply Zone: 24391.30 – 24449.60
Sellers have defended this level previously.
It acted as a ceiling, pushing price back down.
If price returns here, be alert for shorting opportunities with bearish confirmation.
🟪 Possible Supply Zone (Untested): 24558.35 – 24589.15
This zone hasn’t been tested yet.
If price breaks above the first supply zone, this could be the next target or reversal point.
📈 How to Trade This Setup:
🟢 Long Trade Idea – Buy from Demand Zone
Entry: Near 23922–23984 (once price shows reversal candles or bullish volume)
Stop Loss: Just below 23922
Target: 24391–24449 (tested supply zone)
🔴 Short Trade Idea – Sell from Supply Zone
Entry: Near 24391–24449 (look for rejection wicks, volume drop)
Stop Loss: Slightly above 24449
Target: Demand zone near 23984
🔄 Breakout Opportunity
If price breaks above the tested supply zone with volume, watch for a quick move to the next supply zone near 24589.
Re-entry is possible on a retest of the broken zone.
🎯 Pro Trader Tip:
"Don’t chase price. Let it come to your zone. The highest probability trades happen when price enters a zone + confirms with volume."
⚠️ Disclaimer:
This analysis is for educational purposes only and does not constitute any investment advice or stock recommendation. Please consult with your financial advisor before taking any trading decisions. This post complies with SEBI regulations and is intended to promote financial literacy.
🗣️ Let's Discuss:
✅ Are you using supply & demand in your trading?
✅ Want help identifying zones on your favorite stocks?
👇 Drop your charts or questions in the comments — let’s grow together!
Dagangan aktif
Supply zones exhausted - Trade Invalidated📊 STWP | Mentor | Demand & Supply Specialist
🎯 Helping you become a self-reliant & independent trader
🎓 Learn more: simpletradewithpatience.com
📲 WhatsApp: wa.me/919987567889
🔍 Trade with Clarity. Learn with Patience.
🎯 Helping you become a self-reliant & independent trader
🎓 Learn more: simpletradewithpatience.com
📲 WhatsApp: wa.me/919987567889
🔍 Trade with Clarity. Learn with Patience.
Penerbitan berkaitan
Penafian
Maklumat dan penerbitan adalah tidak dimaksudkan untuk menjadi, dan tidak membentuk, nasihat untuk kewangan, pelaburan, perdagangan dan jenis-jenis lain atau cadangan yang dibekalkan atau disahkan oleh TradingView. Baca dengan lebih lanjut di Terma Penggunaan.
📊 STWP | Mentor | Demand & Supply Specialist
🎯 Helping you become a self-reliant & independent trader
🎓 Learn more: simpletradewithpatience.com
📲 WhatsApp: wa.me/919987567889
🔍 Trade with Clarity. Learn with Patience.
🎯 Helping you become a self-reliant & independent trader
🎓 Learn more: simpletradewithpatience.com
📲 WhatsApp: wa.me/919987567889
🔍 Trade with Clarity. Learn with Patience.
Penerbitan berkaitan
Penafian
Maklumat dan penerbitan adalah tidak dimaksudkan untuk menjadi, dan tidak membentuk, nasihat untuk kewangan, pelaburan, perdagangan dan jenis-jenis lain atau cadangan yang dibekalkan atau disahkan oleh TradingView. Baca dengan lebih lanjut di Terma Penggunaan.