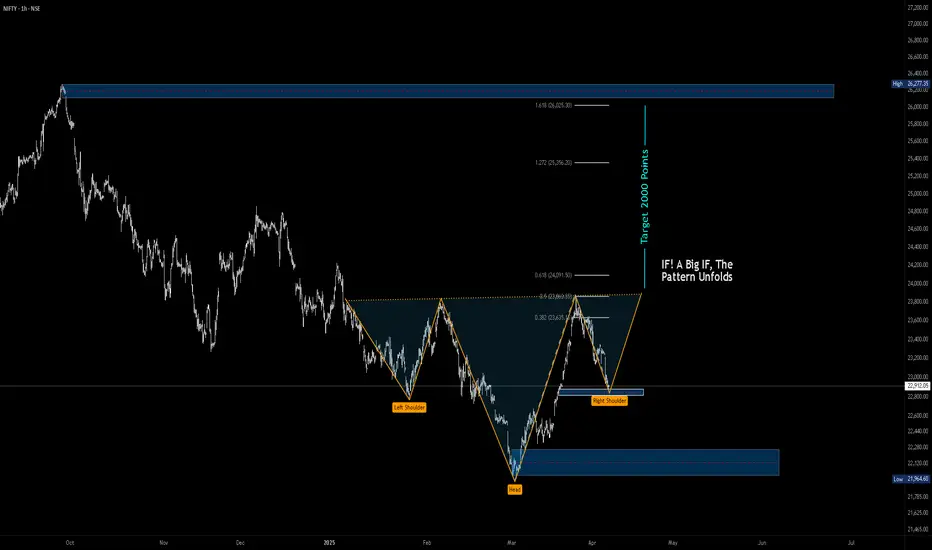
A Big IF is because we are talking about probability here as the pattern is not yet shaped to its prime.
Lets Understand the Inverted Head and Shoulder Pattern
Left Shoulder: After a downtrend, the price of the respective asset makes a low and then rallies to a higher point, forming the left shoulder.
Head: Following the formation of the left shoulder, the price declines to a point lower than the left shoulder and then rallies again, forming the head.
Right Shoulder: Finally, the price declines again but not as low as the previous decline or the head, and then rallies one more time, forming the right shoulder. The right shoulder is typically roughly equal in depth to the left shoulder.
Neckline: A trendline is drawn connecting the high points (or "peaks") after the formation of each shoulder and the head. This line serves as a level of resistance that the price must break through to confirm the pattern.
Lets not get in to the Psychology part. you can find many around.
---------------------------------------------------------------
To Our analysis of nifty for the coming days we can see the same pattern on the chart above.
1st Trade : Advanced Users
If price takes support at around 22800 - 22750 and If you are good in reading volume find reversal to neck line and beyond if you can.
2nd Trade :
If You see price breaking the neck line with good volume (Volume greater than volume average and or greater than previous 3 or 4 candles in Daily Timeframe, Target Is shown on the Chart Nearly All time High.
-----------------------------------------------------------------
One can see that i have plotted FIb Ext on the chart, That clearly shows that the target of this Inverted H&S is absolutely at around 1.618 of FIb Ext.
One can even Consider this as Elliott Wave 3rd wave (I'm not a master in Elliott wave so correct me if i'm wrong)
Note.
A simple Yet powerful Patter so wait for the pattern to unfold for better results.
------------------------------------------------------------------
Monthly Nifty

In the above Picture You can see Monthly Nifty Chart. Which clearly shows that retracement is done and took support at Moving average. Formed a kicker pattern Which is my fav pattern for reversal. Now a retest of Last month candle Mid we can expect a reversal from there. That's where the market closed today. So rest you need work on your analysis. Good Day and Have a nice weekend
Lets Understand the Inverted Head and Shoulder Pattern
Left Shoulder: After a downtrend, the price of the respective asset makes a low and then rallies to a higher point, forming the left shoulder.
Head: Following the formation of the left shoulder, the price declines to a point lower than the left shoulder and then rallies again, forming the head.
Right Shoulder: Finally, the price declines again but not as low as the previous decline or the head, and then rallies one more time, forming the right shoulder. The right shoulder is typically roughly equal in depth to the left shoulder.
Neckline: A trendline is drawn connecting the high points (or "peaks") after the formation of each shoulder and the head. This line serves as a level of resistance that the price must break through to confirm the pattern.
Lets not get in to the Psychology part. you can find many around.
---------------------------------------------------------------
To Our analysis of nifty for the coming days we can see the same pattern on the chart above.
1st Trade : Advanced Users
If price takes support at around 22800 - 22750 and If you are good in reading volume find reversal to neck line and beyond if you can.
2nd Trade :
If You see price breaking the neck line with good volume (Volume greater than volume average and or greater than previous 3 or 4 candles in Daily Timeframe, Target Is shown on the Chart Nearly All time High.
-----------------------------------------------------------------
One can see that i have plotted FIb Ext on the chart, That clearly shows that the target of this Inverted H&S is absolutely at around 1.618 of FIb Ext.
One can even Consider this as Elliott Wave 3rd wave (I'm not a master in Elliott wave so correct me if i'm wrong)
Note.
A simple Yet powerful Patter so wait for the pattern to unfold for better results.
------------------------------------------------------------------
Monthly Nifty
In the above Picture You can see Monthly Nifty Chart. Which clearly shows that retracement is done and took support at Moving average. Formed a kicker pattern Which is my fav pattern for reversal. Now a retest of Last month candle Mid we can expect a reversal from there. That's where the market closed today. So rest you need work on your analysis. Good Day and Have a nice weekend
TeamTaurus
Penafian
Maklumat dan penerbitan adalah tidak dimaksudkan untuk menjadi, dan tidak membentuk, nasihat untuk kewangan, pelaburan, perdagangan dan jenis-jenis lain atau cadangan yang dibekalkan atau disahkan oleh TradingView. Baca dengan lebih lanjut di Terma Penggunaan.
TeamTaurus
Penafian
Maklumat dan penerbitan adalah tidak dimaksudkan untuk menjadi, dan tidak membentuk, nasihat untuk kewangan, pelaburan, perdagangan dan jenis-jenis lain atau cadangan yang dibekalkan atau disahkan oleh TradingView. Baca dengan lebih lanjut di Terma Penggunaan.