Nifty 50 Index on the 15-minute chart is showing key inflection levels with potential trade opportunities around the 24,973–24,991 zone.
Market Context and Bias
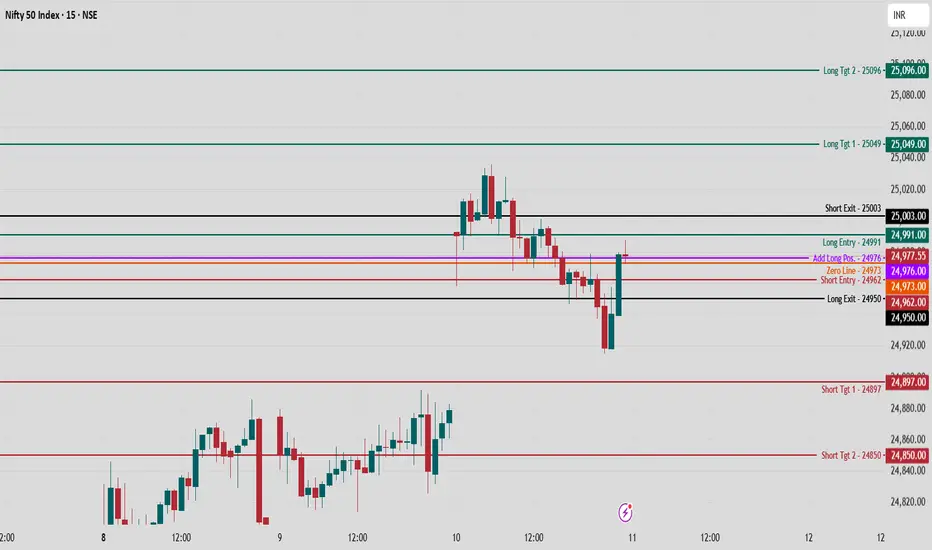
The Index has exhibited strong volatility with an initial downtrend, followed by a sharp bullish reversal candle near intraday lows.
The price is currently testing the “Zero Line” at 24,973 and hovering just below Long Entry at 24,991, suggesting this area is a key battleground between bulls and bears.
Key Levels and Trade Triggers
Long Bias: If sustained above 24,991 (Long Entry), potential targets are 25,049 (Long Tgt 1) and 25,096 (Long Tgt 2). A stop-loss can be managed below 24,962 (Long Exit).
Short Bias: Breakdown below 24,962 (Long Exit) can lead toward 24,897 (Short Tgt 1) and 24,850 (Short Tgt 2), with stops above 24,991.
Neutral/Wait for Confirmation: Zero Line at 24,973 acts as a pivot. Wait for a decisive close above/below for trend confirmation.
Trade Management and Sentiment
Conservative traders can initiate positions above 24,977–24,991 after pullback confirmation, targeting higher resistance, while aggressive short trades are suitable on break and retest below 24,962.
Price action within these triggers reflects a high-stakes zone; avoid over-leverage and maintain discipline at decision points.
Nifty at critical decision zone — watch for sustained move above 24,991 for bullish action, or breakdown below 24,962 for sellers to dominate.
Follow for more such updates!
Market Context and Bias
The Index has exhibited strong volatility with an initial downtrend, followed by a sharp bullish reversal candle near intraday lows.
The price is currently testing the “Zero Line” at 24,973 and hovering just below Long Entry at 24,991, suggesting this area is a key battleground between bulls and bears.
Key Levels and Trade Triggers
Long Bias: If sustained above 24,991 (Long Entry), potential targets are 25,049 (Long Tgt 1) and 25,096 (Long Tgt 2). A stop-loss can be managed below 24,962 (Long Exit).
Short Bias: Breakdown below 24,962 (Long Exit) can lead toward 24,897 (Short Tgt 1) and 24,850 (Short Tgt 2), with stops above 24,991.
Neutral/Wait for Confirmation: Zero Line at 24,973 acts as a pivot. Wait for a decisive close above/below for trend confirmation.
Trade Management and Sentiment
Conservative traders can initiate positions above 24,977–24,991 after pullback confirmation, targeting higher resistance, while aggressive short trades are suitable on break and retest below 24,962.
Price action within these triggers reflects a high-stakes zone; avoid over-leverage and maintain discipline at decision points.
Nifty at critical decision zone — watch for sustained move above 24,991 for bullish action, or breakdown below 24,962 for sellers to dominate.
Follow for more such updates!
Technical Chart Analyst
Track: Indian & US Markets
Indices | Commodities | Crypto
Telegram: @ChartPathik for NSE & MCX
& @ChartPathik_Global for US Ins. & Crypto
WhatsApp: +91-99293-91467 for updates.
Track: Indian & US Markets
Indices | Commodities | Crypto
Telegram: @ChartPathik for NSE & MCX
& @ChartPathik_Global for US Ins. & Crypto
WhatsApp: +91-99293-91467 for updates.
Penafian
Maklumat dan penerbitan adalah tidak dimaksudkan untuk menjadi, dan tidak membentuk, nasihat untuk kewangan, pelaburan, perdagangan dan jenis-jenis lain atau cadangan yang dibekalkan atau disahkan oleh TradingView. Baca dengan lebih lanjut di Terma Penggunaan.