As the trading week wraps up at 02:54 PM IST on September 26, 2025, the Nifty 50 is making headlines with its recent downturn, currently sitting at 24,691.40. With technical indicators flashing red, let’s dive into the latest chart analysis to uncover critical support and resistance levels, and offer a prediction for tomorrow, September 27, 2025. Whether you’re a seasoned trader or a curious investor, this breakdown is your guide to navigating the market’s next move!
EMA Insights: A Bearish Turn
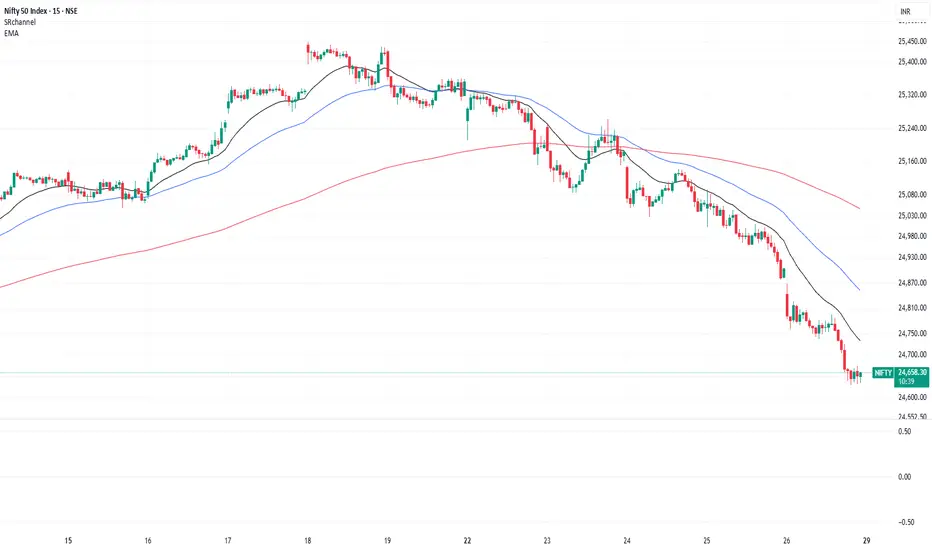
The Nifty 50’s daily chart paints a bearish picture, with the index plunging below key Exponential Moving Averages (EMAs). The 20-period EMA at 24,929.33, 50-period EMA at 25,048.97, and 200-period EMA at 25,000.94 have all turned into resistance zones as the price drops. This decisive break below the 50 EMA signals a shift to a short-term downtrend, hinting at further weakness unless a reversal pattern emerges to challenge the bearish momentum.
RSI Breakdown: Oversold Territory Beckons
The Relative Strength Index (RSI) at 16.443 places the Nifty 50 deep in oversold territory (below 30), suggesting extreme selling pressure and a potential exhaustion point for bears. While this often sets the stage for a technical rebound, the accompanying negative MACD at -127.11 warns that any bounce might be fleeting without strong bullish confirmation. Traders should watch this level closely for signs of a turnaround.
Support and Resistance Levels to Watch
Key support levels are critical for the Nifty 50’s next move. Immediate support lies at 24,716 (S1 pivot), 24,695 (S2), and 24,655 (S3), where buyers might step in for a relief rally, especially given the oversold RSI. A deeper drop could find footing at 24,600, aligning with recent lows. On the resistance side, initial hurdles are at 24,777 (R1) and 24,816 (R2); a sustained break above 24,838 (R3) could indicate stabilization, though the current sell bias favors resistance holding firm.
Tomorrow’s Market Prediction: What Lies Ahead
Looking ahead to September 27, 2025, the Nifty 50 faces intensified downside risks, with the potential to test supports at 24,695-24,655 if selling continues. However, the deeply oversold RSI opens the door for an intraday bounce toward 24,777-24,800, particularly if positive global cues emerge overnight. The bias leans bearish/neutral, with volume being the key to spotting reversal signs. Expect range-bound action unless the index breaches below 24,650, which could accelerate a move toward 24,500. Stay vigilant and ready to adapt!
This analysis blends real-time data with technical expertise, offering a clear roadmap for tomorrow’s trading session. Keep this page bookmarked for updates, and let’s tackle the Nifty 50’s next chapter together!
EMA Insights: A Bearish Turn
The Nifty 50’s daily chart paints a bearish picture, with the index plunging below key Exponential Moving Averages (EMAs). The 20-period EMA at 24,929.33, 50-period EMA at 25,048.97, and 200-period EMA at 25,000.94 have all turned into resistance zones as the price drops. This decisive break below the 50 EMA signals a shift to a short-term downtrend, hinting at further weakness unless a reversal pattern emerges to challenge the bearish momentum.
RSI Breakdown: Oversold Territory Beckons
The Relative Strength Index (RSI) at 16.443 places the Nifty 50 deep in oversold territory (below 30), suggesting extreme selling pressure and a potential exhaustion point for bears. While this often sets the stage for a technical rebound, the accompanying negative MACD at -127.11 warns that any bounce might be fleeting without strong bullish confirmation. Traders should watch this level closely for signs of a turnaround.
Support and Resistance Levels to Watch
Key support levels are critical for the Nifty 50’s next move. Immediate support lies at 24,716 (S1 pivot), 24,695 (S2), and 24,655 (S3), where buyers might step in for a relief rally, especially given the oversold RSI. A deeper drop could find footing at 24,600, aligning with recent lows. On the resistance side, initial hurdles are at 24,777 (R1) and 24,816 (R2); a sustained break above 24,838 (R3) could indicate stabilization, though the current sell bias favors resistance holding firm.
Tomorrow’s Market Prediction: What Lies Ahead
Looking ahead to September 27, 2025, the Nifty 50 faces intensified downside risks, with the potential to test supports at 24,695-24,655 if selling continues. However, the deeply oversold RSI opens the door for an intraday bounce toward 24,777-24,800, particularly if positive global cues emerge overnight. The bias leans bearish/neutral, with volume being the key to spotting reversal signs. Expect range-bound action unless the index breaches below 24,650, which could accelerate a move toward 24,500. Stay vigilant and ready to adapt!
This analysis blends real-time data with technical expertise, offering a clear roadmap for tomorrow’s trading session. Keep this page bookmarked for updates, and let’s tackle the Nifty 50’s next chapter together!
Penafian
Maklumat dan penerbitan adalah tidak bertujuan, dan tidak membentuk, nasihat atau cadangan kewangan, pelaburan, dagangan atau jenis lain yang diberikan atau disahkan oleh TradingView. Baca lebih dalam Terma Penggunaan.
Penafian
Maklumat dan penerbitan adalah tidak bertujuan, dan tidak membentuk, nasihat atau cadangan kewangan, pelaburan, dagangan atau jenis lain yang diberikan atau disahkan oleh TradingView. Baca lebih dalam Terma Penggunaan.