📊 Nifty Trading Plan – 23-May-2025
Chart Timeframe: 15 Min | Reference Spot Price: 24,637
Gap Opening Threshold: 100+ Points
🛡️ Options Trading – Risk Management Tips
✅ Trade with a predefined stop-loss based on spot levels, not just option premiums.
✅ Use ATM or slightly ITM options to minimize time decay and benefit from delta movement.
✅ Avoid buying OTM options at open, especially on flat or range-bound days.
✅ Don’t trade in No Trade Zones (24,577 – 24,648) unless a clear breakout/breakdown happens.
✅ Book partial profits and trail SL once your trade starts working.
✅ Never overleverage—risk only 1–2% of your capital per trade.
✅ Take a break after 2 stop-losses; overtrading reduces clarity and increases risk.
📌 Summary & Conclusion
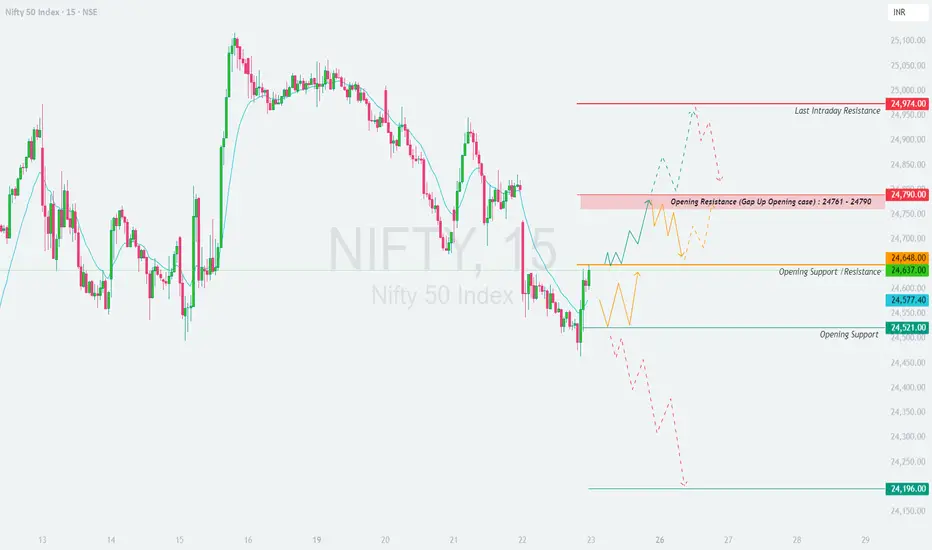
🔹 Opening Resistance Zone: 24,761 – 24,790
🔹 Last Resistance: 24,974
🔹 Opening Support / Resistance Mid-Zone: 24,648
🔹 Support Zone: 24,577 – 24,521
🔹 Last Support: 24,196
🕒 First 15–30 mins are crucial. Let price action unfold before executing any trade.
🎯 Only enter trades after confirmation candles near key zones.
⚖️ Risk-to-reward setups are best near edges of the support/resistance levels, not in the middle zone.
📈 Trend confirmation + volume + candlestick patterns = High Probability Setup.
⚠️ Disclaimer:
I am not a SEBI-registered analyst. This trading plan is shared for educational and informational purposes only. Always consult with a registered financial advisor before taking any investment or trading decisions.
Chart Timeframe: 15 Min | Reference Spot Price: 24,637
Gap Opening Threshold: 100+ Points
- 🚀 Gap-Up Opening (100+ Points Above Previous Close)
If Nifty opens above 24,737 (i.e., 100+ points higher), it will directly enter the critical Opening Resistance Zone: 24,761 – 24,790.
🟥 This zone has historically shown supply pressure, and a direct gap-up into it might lead to either a quick rejection or consolidation.
✅ Plan of Action:
– Avoid immediate long trades at open if price opens inside this zone.
– Wait for a 15-min candle to close above 24,790 to confirm bullish strength. If successful, Nifty could aim for 24,974, the last intraday resistance.
– If a bearish rejection pattern forms (like an inverted hammer or bearish engulfing) in this zone, consider a sell-on-rise setup targeting a retest of 24,648 and possibly down to 24,577.
– Ideal stop loss for shorts: Above 24,800–24,810.
🎓 Educational Insight: Gap-ups into resistance zones often trap breakout traders. Patience is key—let price confirm before acting.
- 📈 Flat Opening (within ±100 Points from Previous Close)
If Nifty opens between 24,537 – 24,737, it will be inside the indecisive zone between support and resistance.
🟧 This is often a low-conviction zone where both buyers and sellers test each other, causing choppy price action in the initial 30 minutes.
✅ Plan of Action:
– Avoid trading in the very first 15–30 minutes; let the market provide direction.
– If price holds above 24,648 and breaks out of 24,761, it can extend toward 24,790, and possibly test 24,974.
– If price fails to hold 24,577 and slips below 24,521, expect downside toward 24,196, the major support zone.
– Inside this range, prefer to trade only on confirmed breakouts or breakdowns with volume support.
🎓 Educational Insight: In flat openings, fakeouts are common. Let breakout candles be confirmed with size and volume.
- 📉 Gap-Down Opening (100+ Points Below Previous Close)
If Nifty opens below 24,537 (i.e., near 24,500 or lower), it will be close to the strong Opening Support Zone: 24,521 – 24,577.
🟩 This zone has previously acted as a demand area and could attract buyers trying to play a reversal.
✅ Plan of Action:
– Observe price behavior near 24,521.
– If bullish reversal patterns emerge (e.g., hammer, bullish engulfing), and Nifty holds above this zone, consider long trade setups targeting a move back to 24,648 and potentially 24,761.
– If Nifty breaks down with a 15-min close below 24,521, sellers may gain control. Look for a further decline to 24,196, the last strong support.
– Ideal stop loss for longs: Below 24,500.
– Ideal stop loss for breakdown shorts: Above 24,540.
🎓 Educational Insight: Don't blindly buy into support zones—watch for confirmation candles to avoid catching a falling knife.
🛡️ Options Trading – Risk Management Tips
✅ Trade with a predefined stop-loss based on spot levels, not just option premiums.
✅ Use ATM or slightly ITM options to minimize time decay and benefit from delta movement.
✅ Avoid buying OTM options at open, especially on flat or range-bound days.
✅ Don’t trade in No Trade Zones (24,577 – 24,648) unless a clear breakout/breakdown happens.
✅ Book partial profits and trail SL once your trade starts working.
✅ Never overleverage—risk only 1–2% of your capital per trade.
✅ Take a break after 2 stop-losses; overtrading reduces clarity and increases risk.
📌 Summary & Conclusion
🔹 Opening Resistance Zone: 24,761 – 24,790
🔹 Last Resistance: 24,974
🔹 Opening Support / Resistance Mid-Zone: 24,648
🔹 Support Zone: 24,577 – 24,521
🔹 Last Support: 24,196
🕒 First 15–30 mins are crucial. Let price action unfold before executing any trade.
🎯 Only enter trades after confirmation candles near key zones.
⚖️ Risk-to-reward setups are best near edges of the support/resistance levels, not in the middle zone.
📈 Trend confirmation + volume + candlestick patterns = High Probability Setup.
⚠️ Disclaimer:
I am not a SEBI-registered analyst. This trading plan is shared for educational and informational purposes only. Always consult with a registered financial advisor before taking any investment or trading decisions.
Penafian
The information and publications are not meant to be, and do not constitute, financial, investment, trading, or other types of advice or recommendations supplied or endorsed by TradingView. Read more in the Terms of Use.
Penafian
The information and publications are not meant to be, and do not constitute, financial, investment, trading, or other types of advice or recommendations supplied or endorsed by TradingView. Read more in the Terms of Use.