📊 NIFTY TRADING PLAN – 29-Aug-2025
📌 Key Levels to Watch:
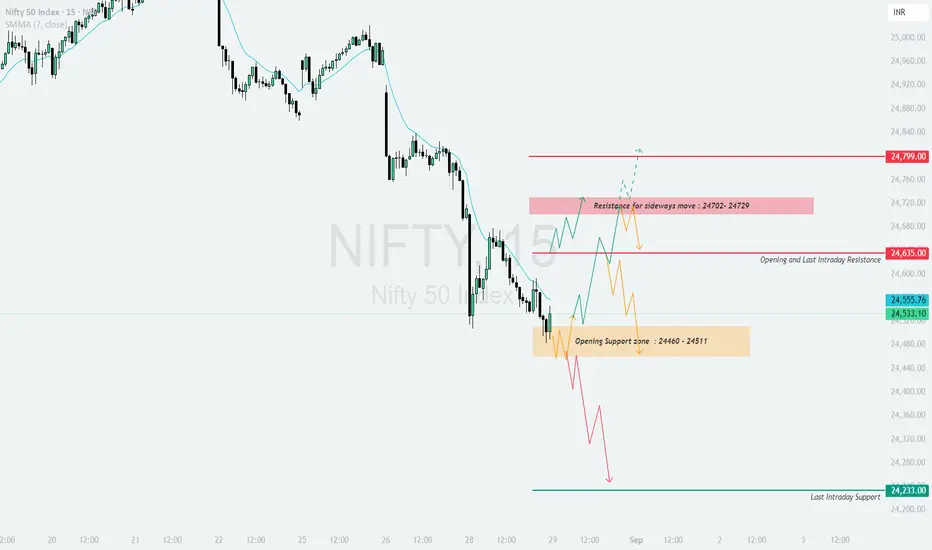
Opening & Last Intraday Resistance: 24,635
Resistance Zone for Sideways Move: 24,702 – 24,729
Major Resistance Above: 24,799
Opening Support Zone: 24,460 – 24,511
Last Intraday Support: 24,233
These levels highlight the battlefield where intraday buyers and sellers are likely to show their strength.
🔼 1. Gap-Up Opening (100+ points above 24,635)
If Nifty opens with a strong gap above 24,635, bullish momentum can extend.
📌 Plan of Action:
👉 Educational Note: On large gap-ups, avoid chasing momentum in the first 15 minutes. Wait for a pullback towards support for better risk-reward trades.
➖ 2. Flat Opening (Around 24,533 ± 50 points)
If Nifty opens flat near its current levels, the market will test supports and resistances for direction.
📌 Plan of Action:
👉 Educational Note: Flat openings often lead to choppy sessions. Patience is crucial—wait for clear candle closes around levels before making a move.
🔽 3. Gap-Down Opening (100+ points below 24,460)
If Nifty opens sharply below 24,460, sellers will maintain an upper hand.
📌 Plan of Action:
👉 Educational Note: Gap-downs often cause panic. Stick to your trading levels and avoid counter-trend entries unless there’s strong confirmation.
🛡️ Risk Management Tips for Options Traders
📌 Summary & Conclusion
🟢 Above 24,635 → Rally towards 24,702–24,729 → 24,799 possible.
🟧 Flat near 24,533 → Watch 24,511 (support) and 24,635 (resistance) for breakout.
🔴 Below 24,460 → Weakness towards 24,233 (critical support zone).
🎯 The tug-of-war lies between 24,460–24,635—whichever side breaks first will decide intraday trend.
⚠️ Disclaimer: I am not a SEBI-registered analyst. This trading plan is purely for educational purposes and should not be considered investment advice. Please do your own research or consult a financial advisor before trading.
📌 Key Levels to Watch:
Opening & Last Intraday Resistance: 24,635
Resistance Zone for Sideways Move: 24,702 – 24,729
Major Resistance Above: 24,799
Opening Support Zone: 24,460 – 24,511
Last Intraday Support: 24,233
These levels highlight the battlefield where intraday buyers and sellers are likely to show their strength.
🔼 1. Gap-Up Opening (100+ points above 24,635)
If Nifty opens with a strong gap above 24,635, bullish momentum can extend.
📌 Plan of Action:
- [] Sustaining above 24,702–24,729 (sideways resistance) can lift the index towards 24,799.
[] This zone is ideal for partial profit booking as supply pressure may emerge. - If the index fails to sustain above 24,702, expect sideways consolidation between 24,635–24,729 before any decisive move.
👉 Educational Note: On large gap-ups, avoid chasing momentum in the first 15 minutes. Wait for a pullback towards support for better risk-reward trades.
➖ 2. Flat Opening (Around 24,533 ± 50 points)
If Nifty opens flat near its current levels, the market will test supports and resistances for direction.
📌 Plan of Action:
- [] Holding above 24,511 will keep momentum intact for a test of 24,635.
[] A breakout above 24,635 may lead to a rally towards 24,702–24,729. - On the other hand, slipping below 24,460 may invite selling pressure, opening the path to 24,233.
👉 Educational Note: Flat openings often lead to choppy sessions. Patience is crucial—wait for clear candle closes around levels before making a move.
🔽 3. Gap-Down Opening (100+ points below 24,460)
If Nifty opens sharply below 24,460, sellers will maintain an upper hand.
📌 Plan of Action:
- [] Below 24,460, weakness can accelerate towards 24,233 (last intraday support).
[] Strong demand may emerge near 24,233; watch for long wicks or bullish reversal candles for intraday buying opportunities. - If 24,233 breaks decisively, the next phase of downside may trigger a deeper sell-off.
👉 Educational Note: Gap-downs often cause panic. Stick to your trading levels and avoid counter-trend entries unless there’s strong confirmation.
🛡️ Risk Management Tips for Options Traders
- [] Limit risk to 1–2% of capital per trade.
[] Use hourly close stop-losses for confirmation.
[] Consider spreads (Bull Call / Bear Put) to reduce time decay impact.
[] Book profits in parts—don’t wait for exact top or bottom. - Track India VIX closely, as volatility affects option premiums.
📌 Summary & Conclusion
🟢 Above 24,635 → Rally towards 24,702–24,729 → 24,799 possible.
🟧 Flat near 24,533 → Watch 24,511 (support) and 24,635 (resistance) for breakout.
🔴 Below 24,460 → Weakness towards 24,233 (critical support zone).
🎯 The tug-of-war lies between 24,460–24,635—whichever side breaks first will decide intraday trend.
⚠️ Disclaimer: I am not a SEBI-registered analyst. This trading plan is purely for educational purposes and should not be considered investment advice. Please do your own research or consult a financial advisor before trading.
Penafian
The information and publications are not meant to be, and do not constitute, financial, investment, trading, or other types of advice or recommendations supplied or endorsed by TradingView. Read more in the Terms of Use.
Penafian
The information and publications are not meant to be, and do not constitute, financial, investment, trading, or other types of advice or recommendations supplied or endorsed by TradingView. Read more in the Terms of Use.