Nifty 50 Index spot 23519.35 by Daily Chart view - Weekly update
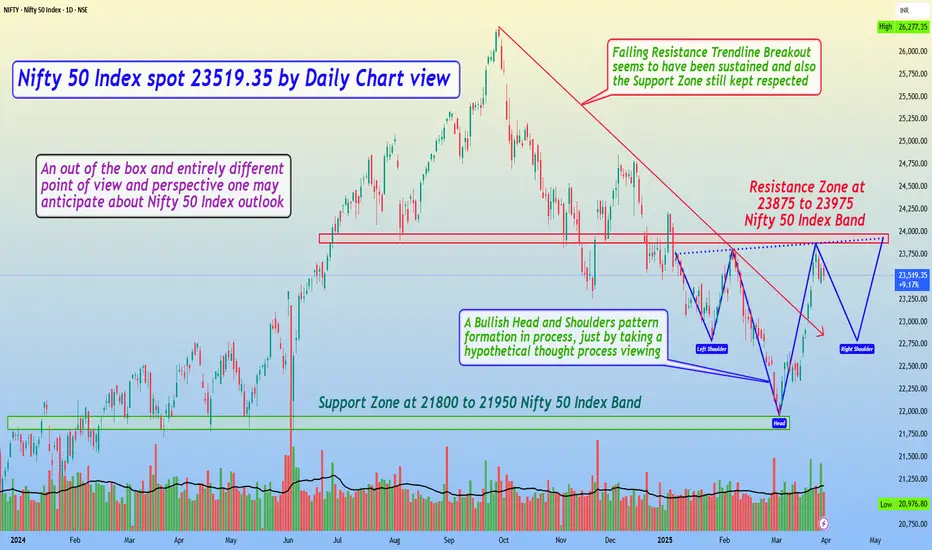
- Support Zone at 21800 to 21950 Nifty 50 Index Band
- Resistance Zone at 23875 to 23975 Nifty 50 Index Band
- Falling Resistance Trendline Breakout seems to have been sustained and also Support Zone still kept respected
- A Bullish Head and Shoulders pattern formation in process, just by taking a hypothetical thought process viewing
- An out of the box and entirely different point of view and perspective one may anticipate about Nifty 50 Index outlook
- Going by this Hypothetical H&S probability for the Nifty 50 Index Chart, we may anticipate good fire crackers to observe
- As such this is just a high level technical chart pattern formation and the Market are always Supreme to work in their own ways
Nota
The probable Head & Shoulders pattern may be considered as a Double Rounding Bottom too, based on how the outcome unfolds over the coming days. It rejection happens at the Resistance Zone then H&S may be anticipated but if Resistance Zone is broken and price action moves on above it then the Bullish Rounding Bottom pattern would prevail. Rest Markets are Supreme and would work in their own ways. Let us hope for the best to happen.Penerbitan berkaitan
Penafian
Maklumat dan penerbitan adalah tidak dimaksudkan untuk menjadi, dan tidak membentuk, nasihat untuk kewangan, pelaburan, perdagangan dan jenis-jenis lain atau cadangan yang dibekalkan atau disahkan oleh TradingView. Baca dengan lebih lanjut di Terma Penggunaan.
Penerbitan berkaitan
Penafian
Maklumat dan penerbitan adalah tidak dimaksudkan untuk menjadi, dan tidak membentuk, nasihat untuk kewangan, pelaburan, perdagangan dan jenis-jenis lain atau cadangan yang dibekalkan atau disahkan oleh TradingView. Baca dengan lebih lanjut di Terma Penggunaan.