4-Hour Chart (Macro Trend)
Structure: The long-term trend is still technically intact, but the index has now decisively broken down from its short-term ascending channel and is trading within a steep corrective channel. The price closed right on the 25,050 - 25,100 major demand zone. This zone is a confluence of a prior breakout level, a FVG (Fair Value Gap), and psychological support at 25,000.
Key Levels:
Major Supply (Resistance): 25,300 - 25,400. This area is now a strong resistance zone. The price will struggle to move past this level.
Major Demand (Support): 25,000 - 25,100. This is the most critical support zone. A sustained break below this area would trigger a major trend reversal and accelerate the selling.
Outlook: The market is at a make-or-break juncture. As long as the Nifty holds above 25,000, the "buy on dips" strategy remains viable; otherwise, the long-term structure will turn bearish.
1-Hour Chart (Intermediate View)
Structure: The 1H chart shows a clear continuation of the MSS (Market Structure Shift) to the downside. The index is trading within a descending channel and consistently making lower highs and lower lows. The close at 25,060 is a significant test of the support.
Key Levels:
Immediate Resistance: The upper trendline of the descending channel and a minor resistance at 25,180 - 25,200.
Immediate Support: 25,000. This psychological level is the immediate target for bears.
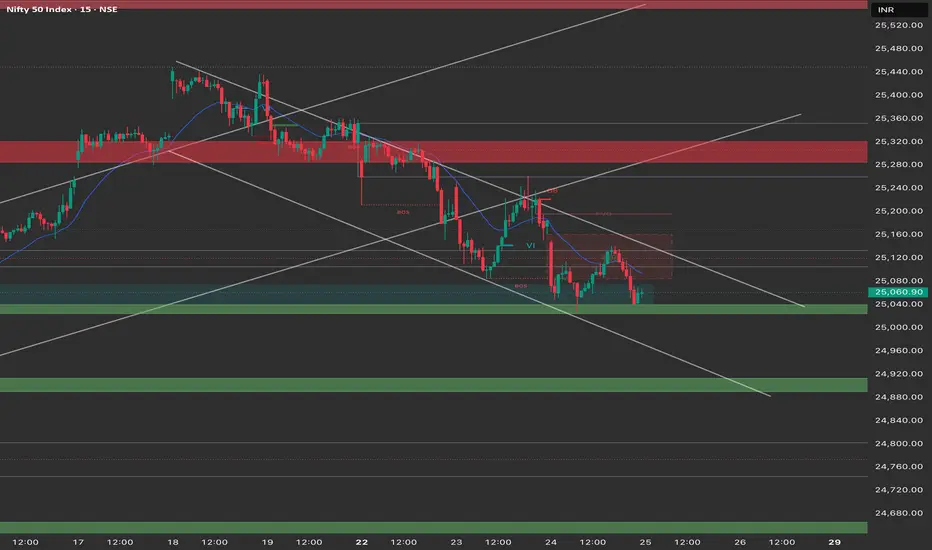
15-Minute Chart (Intraday View)
Structure: The 15M chart confirms the intraday downtrend. The price closed at the low of the day, within the major demand zone. The strong selling momentum from the last session suggests the bears are in control for the start of the next session.
Key Levels:
Intraday Supply: The 25,100 level.
Intraday Demand: The 25,000 level.
Outlook: The intraday bias is bearish. The market is likely to remain under selling pressure unless there is a strong gap-up.
Trade Plan (Thursday, 25th September)
Market Outlook: The market is now at its most critical support level ahead of the monthly expiry. The overall bias is bearish below 25,100.
Bearish Scenario (Primary Plan)
Justification: The market structure is bearish on the short-term charts, and a breakdown of the major 25,000 support will confirm a deeper correction.
Entry: Look for a short entry on a decisive break and 15-minute candle close below 25,000.
Stop Loss (SL): Place a stop loss above 25,100.
Targets:
T1: 24,900 (Next major demand zone, 4H chart).
T2: 24,800 (Extension target).
Bullish Scenario (Counter-Trend/Reversal Plan)
Justification: This is a high-risk, high-reward reversal plan based on the defense of the critical macro support.
Trigger: A strong bullish reversal candle (e.g., a morning star or large engulfing pattern) near the 25,000 level, or a sustained move and close above the immediate resistance.
Entry: Long entry on a confirmed move and 15-minute candle close above 25,180.
Stop Loss (SL): Below 25,050.
Targets:
T1: 25,300 (Recent swing high and FVG zone).
T2: 25,400 (Next major resistance).
Key Levels for Observation:
Immediate Decision Point: The 25,000 - 25,100 zone.
Bearish Confirmation: A break and sustained move below 25,000.
Bullish Confirmation: A recapture of the 25,180 level.
Line in the Sand: 25,000. The overall uptrend is broken if this level is breached.
Structure: The long-term trend is still technically intact, but the index has now decisively broken down from its short-term ascending channel and is trading within a steep corrective channel. The price closed right on the 25,050 - 25,100 major demand zone. This zone is a confluence of a prior breakout level, a FVG (Fair Value Gap), and psychological support at 25,000.
Key Levels:
Major Supply (Resistance): 25,300 - 25,400. This area is now a strong resistance zone. The price will struggle to move past this level.
Major Demand (Support): 25,000 - 25,100. This is the most critical support zone. A sustained break below this area would trigger a major trend reversal and accelerate the selling.
Outlook: The market is at a make-or-break juncture. As long as the Nifty holds above 25,000, the "buy on dips" strategy remains viable; otherwise, the long-term structure will turn bearish.
1-Hour Chart (Intermediate View)
Structure: The 1H chart shows a clear continuation of the MSS (Market Structure Shift) to the downside. The index is trading within a descending channel and consistently making lower highs and lower lows. The close at 25,060 is a significant test of the support.
Key Levels:
Immediate Resistance: The upper trendline of the descending channel and a minor resistance at 25,180 - 25,200.
Immediate Support: 25,000. This psychological level is the immediate target for bears.
15-Minute Chart (Intraday View)
Structure: The 15M chart confirms the intraday downtrend. The price closed at the low of the day, within the major demand zone. The strong selling momentum from the last session suggests the bears are in control for the start of the next session.
Key Levels:
Intraday Supply: The 25,100 level.
Intraday Demand: The 25,000 level.
Outlook: The intraday bias is bearish. The market is likely to remain under selling pressure unless there is a strong gap-up.
Trade Plan (Thursday, 25th September)
Market Outlook: The market is now at its most critical support level ahead of the monthly expiry. The overall bias is bearish below 25,100.
Bearish Scenario (Primary Plan)
Justification: The market structure is bearish on the short-term charts, and a breakdown of the major 25,000 support will confirm a deeper correction.
Entry: Look for a short entry on a decisive break and 15-minute candle close below 25,000.
Stop Loss (SL): Place a stop loss above 25,100.
Targets:
T1: 24,900 (Next major demand zone, 4H chart).
T2: 24,800 (Extension target).
Bullish Scenario (Counter-Trend/Reversal Plan)
Justification: This is a high-risk, high-reward reversal plan based on the defense of the critical macro support.
Trigger: A strong bullish reversal candle (e.g., a morning star or large engulfing pattern) near the 25,000 level, or a sustained move and close above the immediate resistance.
Entry: Long entry on a confirmed move and 15-minute candle close above 25,180.
Stop Loss (SL): Below 25,050.
Targets:
T1: 25,300 (Recent swing high and FVG zone).
T2: 25,400 (Next major resistance).
Key Levels for Observation:
Immediate Decision Point: The 25,000 - 25,100 zone.
Bearish Confirmation: A break and sustained move below 25,000.
Bullish Confirmation: A recapture of the 25,180 level.
Line in the Sand: 25,000. The overall uptrend is broken if this level is breached.
Penafian
Maklumat dan penerbitan adalah tidak bertujuan, dan tidak membentuk, nasihat atau cadangan kewangan, pelaburan, dagangan atau jenis lain yang diberikan atau disahkan oleh TradingView. Baca lebih dalam Terma Penggunaan.
Penafian
Maklumat dan penerbitan adalah tidak bertujuan, dan tidak membentuk, nasihat atau cadangan kewangan, pelaburan, dagangan atau jenis lain yang diberikan atau disahkan oleh TradingView. Baca lebih dalam Terma Penggunaan.