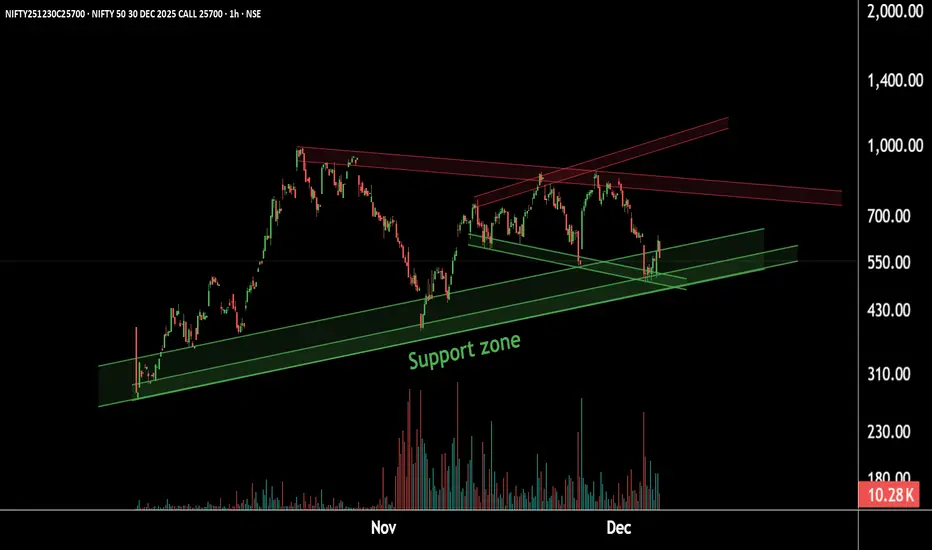
This is the 1-hour timeframe chart of the NIFTY 25,700 CE.
The option is currently trending near a strong support zone at ₹450–₹500.
The chart indicates that the call is taking support at this level, and any dip into this zone may trigger a bullish reversal.
If this support holds, we may witness an upside move toward the potential resistance area of ₹800–₹850 , short term level 680 and 730 .
Thank you.
@RahulSaraoge
Connect us at t.me/stridesadvisory
Connect us at t.me/stridesadvisory
Penafian
Maklumat dan penerbitan adalah tidak bertujuan, dan tidak membentuk, nasihat atau cadangan kewangan, pelaburan, dagangan atau jenis lain yang diberikan atau disahkan oleh TradingView. Baca lebih dalam Terma Penggunaan.