📈 11-Day Technical Overview
Over the past 11 trading days, the index has experienced a modest upward movement, indicating a neutral to mildly bullish trend. Key technical indicators suggest a balanced market sentiment:
Relative Strength Index (RSI): Hovering around neutral levels, indicating neither overbought nor oversold conditions.
Moving Average Convergence Divergence (MACD): Currently showing a bullish crossover, suggesting potential upward momentum.
Average Directional Index (ADX): At approximately 22.69, with a Positive Directional Indicator (PDI) at 27.41 and a Negative Directional Indicator (MDI) at 14.54, indicating a mild bullish trend.
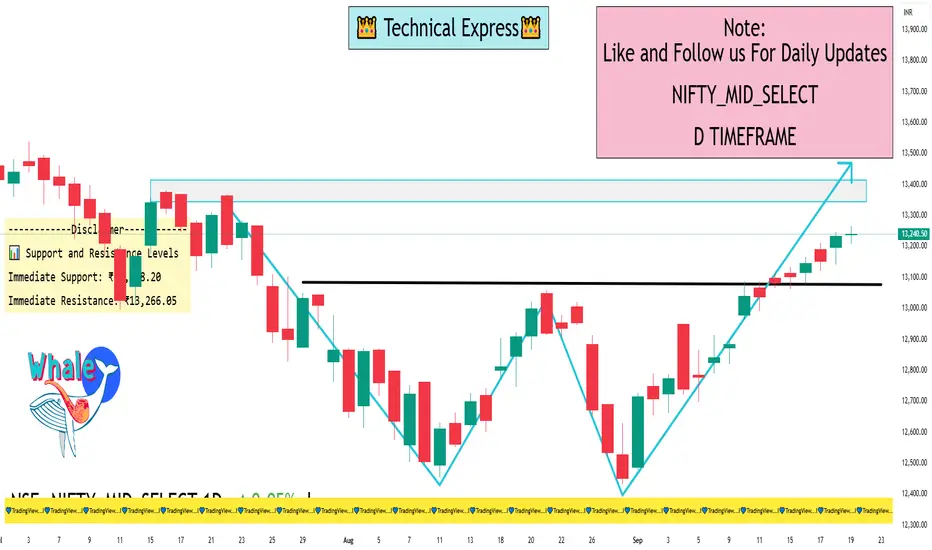
📊 Support and Resistance Levels
Immediate Support: ₹13,208.20
Immediate Resistance: ₹13,266.05
A breakout above the resistance level could signal a continuation of the upward trend, while a dip below support may indicate a potential reversal.
📌 Investment Options
Investors interested in gaining exposure to the Nifty Midcap Select Index can consider the following options:
Exchange-Traded Funds (ETFs): These funds replicate the performance of the index and can be traded on the stock exchange.
Index Funds: Mutual funds that aim to mirror the index's performance.
Futures & Options: Derivative contracts based on the index, suitable for more experienced investors.
Direct Stock Investment: Investing in the constituent stocks of the index in the same proportion as the index.
Over the past 11 trading days, the index has experienced a modest upward movement, indicating a neutral to mildly bullish trend. Key technical indicators suggest a balanced market sentiment:
Relative Strength Index (RSI): Hovering around neutral levels, indicating neither overbought nor oversold conditions.
Moving Average Convergence Divergence (MACD): Currently showing a bullish crossover, suggesting potential upward momentum.
Average Directional Index (ADX): At approximately 22.69, with a Positive Directional Indicator (PDI) at 27.41 and a Negative Directional Indicator (MDI) at 14.54, indicating a mild bullish trend.
📊 Support and Resistance Levels
Immediate Support: ₹13,208.20
Immediate Resistance: ₹13,266.05
A breakout above the resistance level could signal a continuation of the upward trend, while a dip below support may indicate a potential reversal.
📌 Investment Options
Investors interested in gaining exposure to the Nifty Midcap Select Index can consider the following options:
Exchange-Traded Funds (ETFs): These funds replicate the performance of the index and can be traded on the stock exchange.
Index Funds: Mutual funds that aim to mirror the index's performance.
Futures & Options: Derivative contracts based on the index, suitable for more experienced investors.
Direct Stock Investment: Investing in the constituent stocks of the index in the same proportion as the index.
I built a Buy & Sell Signal Indicator with 85% accuracy.
📈 Get access via DM or
WhatsApp: wa.link/d997q0
Contact - +91 76782 40962
| Email: techncialexpress@gmail.com
| Script Coder | Trader | Investor | From India
📈 Get access via DM or
WhatsApp: wa.link/d997q0
Contact - +91 76782 40962
| Email: techncialexpress@gmail.com
| Script Coder | Trader | Investor | From India
Penerbitan berkaitan
Penafian
Maklumat dan penerbitan adalah tidak bertujuan, dan tidak membentuk, nasihat atau cadangan kewangan, pelaburan, dagangan atau jenis lain yang diberikan atau disahkan oleh TradingView. Baca lebih dalam Terma Penggunaan.