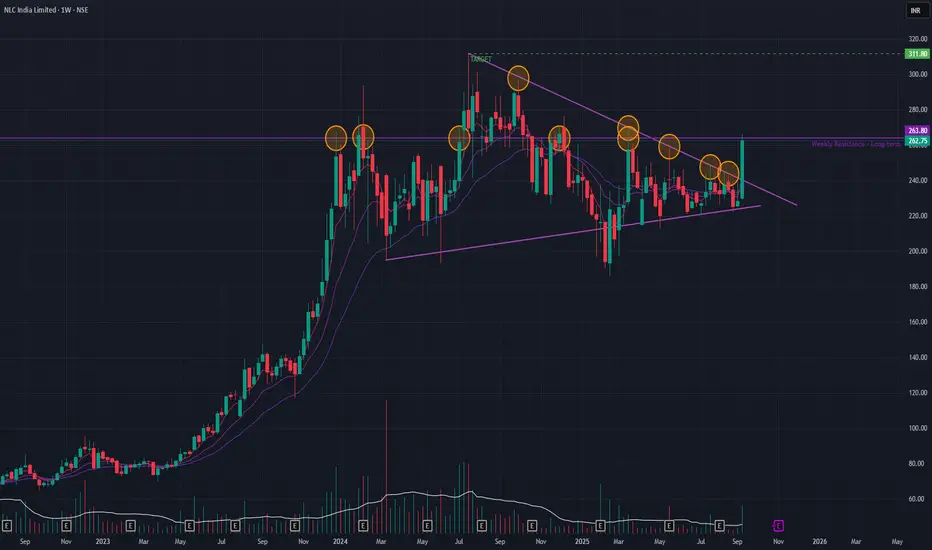
Following its all-time high, NLC India has been consolidating in a sideways pattern, which can be interpreted as a bullish triangle formation—often a precursor to an uptrend continuation. This thesis was strongly supported this past week by a powerful +14.97% rally on a massive volume spike, indicating a potential end to the consolidation phase.
However, the stock is now confronting a formidable, long-term horizontal resistance level that has been in place for over a decade (since December 2007). This same trendline has rejected multiple breakout attempts since December 2023. For the bullish momentum to translate into a new leg up, NLC India must decisively breach and hold above this historical barrier. A successful breakout could clear the path for a new all-time high and a near-term target of ₹311.
Price-action will decide the way forward.
Disclaimer: This analysis is my personal view & for educational purposes only. They shall not be construed as trade or investment advice. Before making any financial decision, it is imperative that you consult with a qualified financial professional.
Penafian
Maklumat dan penerbitan adalah tidak bertujuan, dan tidak membentuk, nasihat atau cadangan kewangan, pelaburan, dagangan atau jenis lain yang diberikan atau disahkan oleh TradingView. Baca lebih dalam Terma Penggunaan.