Nasdaq
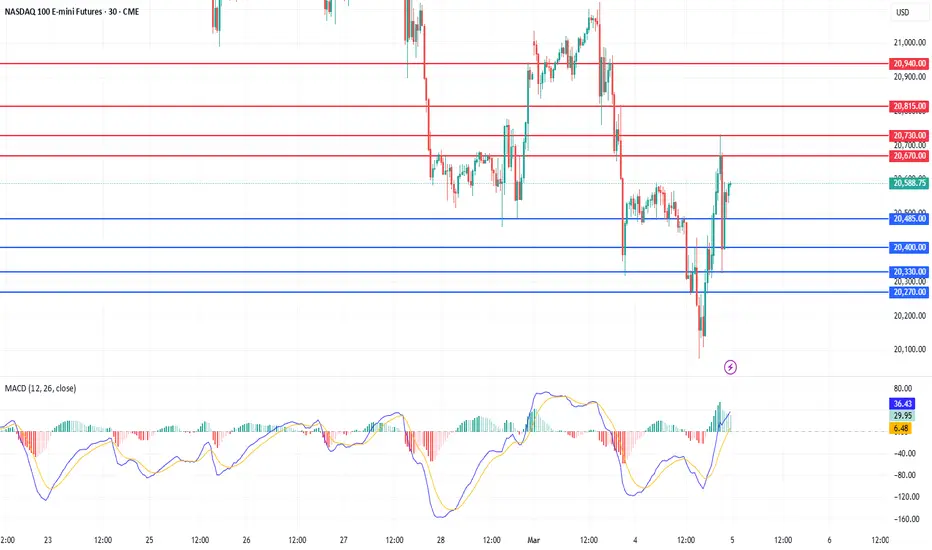
The Nasdaq closed lower as market volatility increased due to tariff concerns. Although the index dropped below the 240-day moving average, it formed a lower wick, indicating an attempt to establish a short-term bottom. On continuous futures, the 240-day MA is slightly below 20,000, meaning that the 20,100–20,000 zone is a key support area where a technical rebound is likely following the recent sharp decline. If the market falls into this zone, it could present a swing buying opportunity. Since the daily MACD and signal line are dropping steeply, a sideways consolidation period may be necessary to reduce their angle and separation before further directional movement.
Given that the Nasdaq rebounded strongly after forming a lower wick yesterday, a pullback in pre-market trading could provide a buy-the-dip opportunity. Additionally, potential bullish catalysts include today’s ADP Non-Farm Employment data and Friday’s Non-Farm Payroll report.
On the 240-minute chart, the index is forming a bullish divergence and attempting a golden cross, reinforcing the buy-the-dip strategy at current levels. Therefore, chasing shorts is not advisable, as the Nasdaq has entered a more attractive buying zone. A range-trading approach remains effective, with a preference for buying near support.
Crude Oil
Crude oil closed lower, finding support near previous demand zones. Despite the continued downtrend, the $66–67 range remains a strong support area, making it a potential rebound zone for technical buyers. However, on the daily chart, the MACD and signal line are sloping downward sharply, meaning that selling pressure could intensify further. Long positions should be initiated as close to the lower support zone as possible.
On the 240-minute chart, the MACD has formed another bearish crossover, confirming strong selling momentum. However, when compared to the previous MACD level near $68.50, price has declined further, but the MACD has not dropped as low, suggesting a potential bullish divergence. Since this zone has historically acted as strong support, a buy-the-dip strategy remains preferable, but traders should remain cautious of today’s Crude Oil Inventory report, which could lead to increased volatility.
Gold
Gold closed higher, successfully rebounding from support. Yesterday, gold reached the previously projected target of 2,925, aligning with the 240-day moving average characteristics.
If gold continues higher, the 2,940 level will act as resistance, as this is a previous supply zone on the daily chart. Therefore, further upside should be monitored carefully before making new decisions. Since the daily MACD and signal line remain widely separated, this is not an ideal condition for chasing long positions. Even if gold extends its rally, a pullback is likely, making buying dips a safer approach.
On the 240-minute chart, the MACD formed a golden cross, leading to a sharp rally. As expected, price reached the 60-day MA following the 240-day MA bounce. However, while the MACD has moved above zero, the signal line is still below zero, meaning that another corrective phase could occur before further upside. Additionally, there is a possibility that gold could revisit the 2,850 support zone to form a double-bottom structure, making buying dips a better strategy than chasing breakouts. Overall, a range-trading strategy—buying low and selling high—remains effective, and today’s ADP Non-Farm Employment data could introduce market volatility.
As market conditions shift, risk management remains crucial. Stay disciplined, adapt to volatility, and trade with confidence. Wishing you a successful trading day! 🚀
If you like my analysis, please follow me and give it a boost!
For additional strategies for today, check out my profile. Thank you!
✅Trade here: vigco.co/iuQbUf
📌You can earn 50 USD for free
📌Over 1,000$ → +20% deposit HUNT
📌Support Metatrader4,5
📌Inquiry : t.me/NikoChoi
✅Trade Inquiry : t.me/Futureguard
📌You can earn 50 USD for free
📌Over 1,000$ → +20% deposit HUNT
📌Support Metatrader4,5
📌Inquiry : t.me/NikoChoi
✅Trade Inquiry : t.me/Futureguard
Penerbitan berkaitan
Penafian
Maklumat dan penerbitan adalah tidak dimaksudkan untuk menjadi, dan tidak membentuk, nasihat untuk kewangan, pelaburan, perdagangan dan jenis-jenis lain atau cadangan yang dibekalkan atau disahkan oleh TradingView. Baca dengan lebih lanjut di Terma Penggunaan.