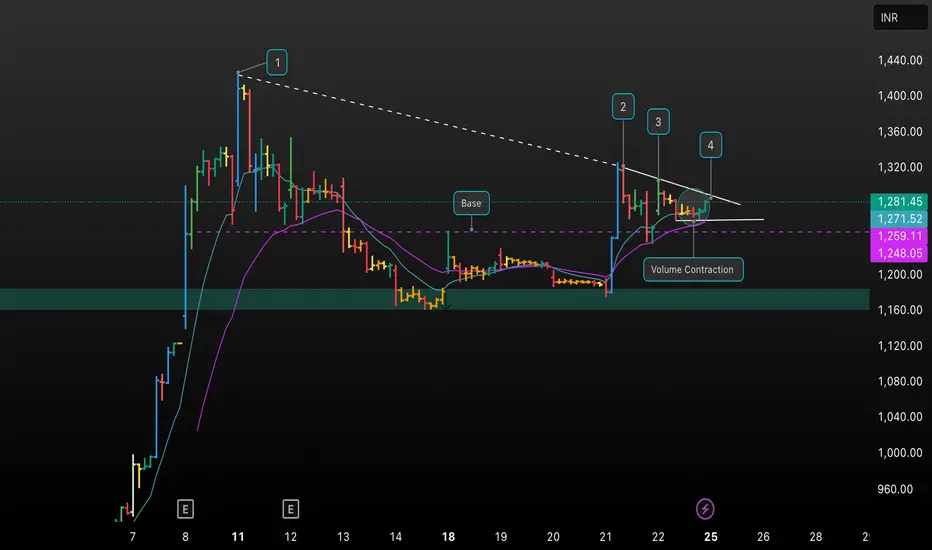
This chart showcases a detailed technical analysis of NSDL on the 45m timeframe, highlighting key price action zones, trendlines, and volume contraction patterns. I’ve marked the base formation, breakout attempts, and areas of interest using numbered points and indicator overlays. Notice the distinct volume contraction phase as price consolidates near resistance, potentially setting up a breakout. Key support/resistance levels and moving averages are also plotted.
Your feedback on this setup or alternative charting perspectives is welcome! Let’s discuss the probabilities and potential trade management for this breakout scenario.
This combination is clear, educational, and designed to invite discussion and engagement from traders and learners.
Your feedback on this setup or alternative charting perspectives is welcome! Let’s discuss the probabilities and potential trade management for this breakout scenario.
This combination is clear, educational, and designed to invite discussion and engagement from traders and learners.
Penafian
Maklumat dan penerbitan adalah tidak dimaksudkan untuk menjadi, dan tidak membentuk, nasihat untuk kewangan, pelaburan, perdagangan dan jenis-jenis lain atau cadangan yang dibekalkan atau disahkan oleh TradingView. Baca dengan lebih lanjut di Terma Penggunaan.
Penafian
Maklumat dan penerbitan adalah tidak dimaksudkan untuk menjadi, dan tidak membentuk, nasihat untuk kewangan, pelaburan, perdagangan dan jenis-jenis lain atau cadangan yang dibekalkan atau disahkan oleh TradingView. Baca dengan lebih lanjut di Terma Penggunaan.