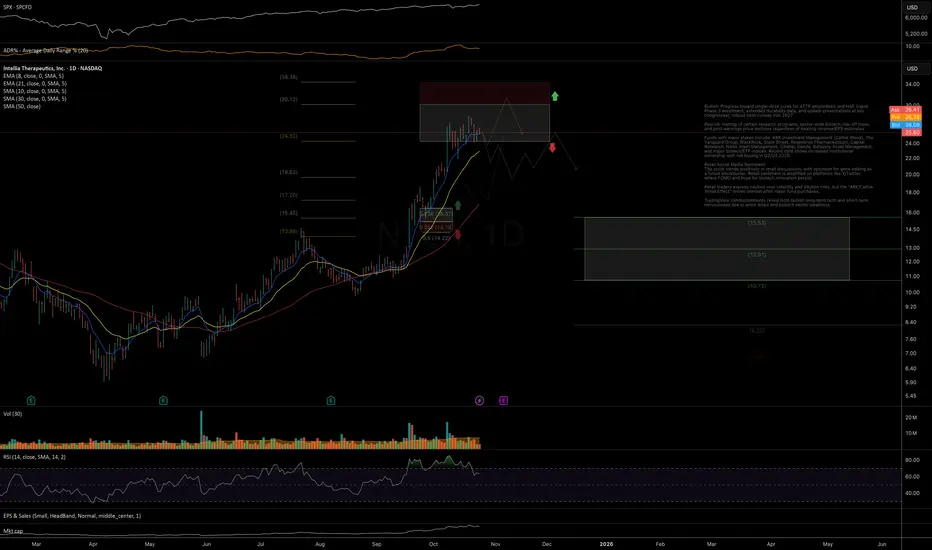
Price has followed through strongly from the mid-term support outlined in the September update, moving directly into the target mid-term resistance zone.
As long as the price remains below 30, I expect a near-term pullback below the 21dEMA to complete the first leg of decline.
If, however, the price breaks out above the October highs, it would open the door for further extensions toward the 31–34 resistance zone in the short term.
Chart:

Previously:
On bullish trend structure and support zone (Sep 26):
Chart:
https://www.tradingview.com/symbols/NASDAQ-NTLA/minds/?mind=B8f6LFmoSxGopGg
On resistance zone and pullback potential (Oct 8 and Oct 13):
Chart:
See weekly review: https://www.tradingview.com/chart/BITF/MXF8r9gK-Weekly-Chart-Review-Oct-6-10-2025/
As long as the price remains below 30, I expect a near-term pullback below the 21dEMA to complete the first leg of decline.
If, however, the price breaks out above the October highs, it would open the door for further extensions toward the 31–34 resistance zone in the short term.
Chart:
Previously:
On bullish trend structure and support zone (Sep 26):
Chart:
https://www.tradingview.com/symbols/NASDAQ-NTLA/minds/?mind=B8f6LFmoSxGopGg
On resistance zone and pullback potential (Oct 8 and Oct 13):
Chart:
See weekly review: https://www.tradingview.com/chart/BITF/MXF8r9gK-Weekly-Chart-Review-Oct-6-10-2025/
Dagangan ditutup: sasaran tercapai
That was fast 📊 Daily FREE Market Insights | Crypto + US Stocks
⚡ Technical analysis, setups & commentary
🌍 t.me/MarketArtistryENG | 🇷🇺 t.me/marketartistry
Join and let's grow together! 🚀
⚡ Technical analysis, setups & commentary
🌍 t.me/MarketArtistryENG | 🇷🇺 t.me/marketartistry
Join and let's grow together! 🚀
Penafian
Maklumat dan penerbitan adalah tidak dimaksudkan untuk menjadi, dan tidak membentuk, nasihat untuk kewangan, pelaburan, perdagangan dan jenis-jenis lain atau cadangan yang dibekalkan atau disahkan oleh TradingView. Baca dengan lebih lanjut di Terma Penggunaan.
📊 Daily FREE Market Insights | Crypto + US Stocks
⚡ Technical analysis, setups & commentary
🌍 t.me/MarketArtistryENG | 🇷🇺 t.me/marketartistry
Join and let's grow together! 🚀
⚡ Technical analysis, setups & commentary
🌍 t.me/MarketArtistryENG | 🇷🇺 t.me/marketartistry
Join and let's grow together! 🚀
Penafian
Maklumat dan penerbitan adalah tidak dimaksudkan untuk menjadi, dan tidak membentuk, nasihat untuk kewangan, pelaburan, perdagangan dan jenis-jenis lain atau cadangan yang dibekalkan atau disahkan oleh TradingView. Baca dengan lebih lanjut di Terma Penggunaan.