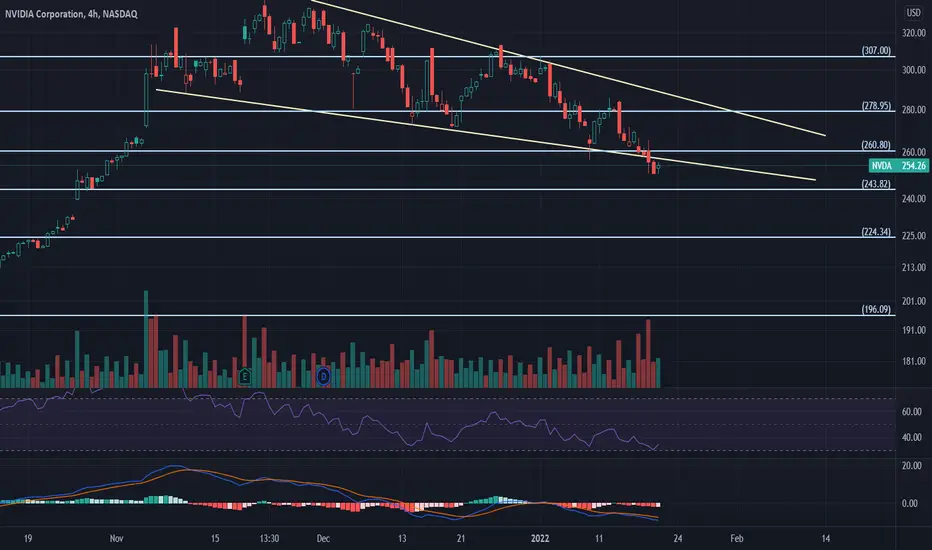
Price has been stuck in a falling wedge since early November. The falling wedge generally indicates a continuation of the prior uptrend; however, in this case, the falling wedge seems to be breaking down. A continuation pattern becoming a reversal pattern is a strong bearish sign; NVDA, just like the rest of the tech sector and the broader market, seems to be entering a bearish period. Place a stop loss at former support, now resistance, of the falling wedge (around $257). Trim at $243; if this level breaks, and it likely will, it won't find much support until the $196 level. Look out for a price drop following FOMC.
Penafian
Maklumat dan penerbitan adalah tidak dimaksudkan untuk menjadi, dan tidak membentuk, nasihat untuk kewangan, pelaburan, perdagangan dan jenis-jenis lain atau cadangan yang dibekalkan atau disahkan oleh TradingView. Baca dengan lebih lanjut di Terma Penggunaan.
Penafian
Maklumat dan penerbitan adalah tidak dimaksudkan untuk menjadi, dan tidak membentuk, nasihat untuk kewangan, pelaburan, perdagangan dan jenis-jenis lain atau cadangan yang dibekalkan atau disahkan oleh TradingView. Baca dengan lebih lanjut di Terma Penggunaan.