Hello, traders.
If you "Follow", you can always get new information quickly.
Please also click "Boost".
Have a nice day today.
-------------------------------------
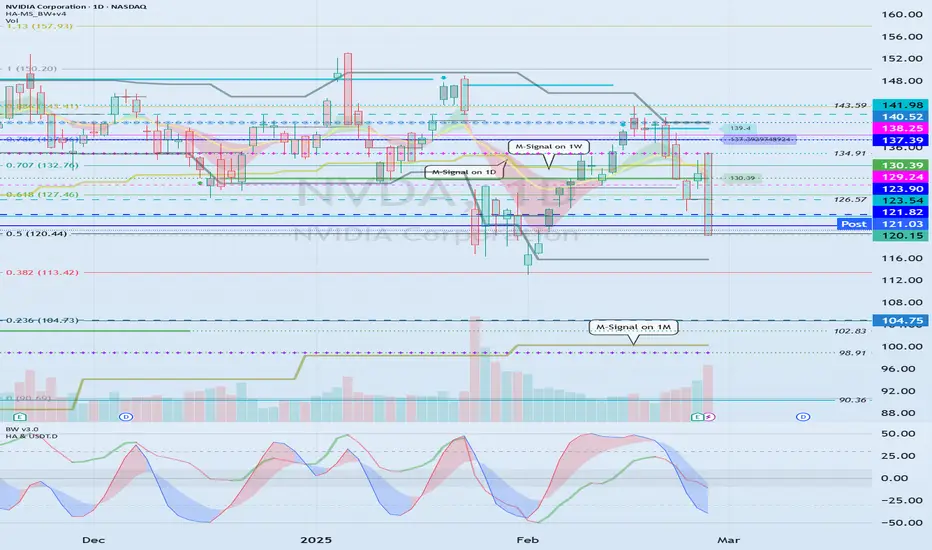
(NVDA 1W chart)
The key is whether it can receive support and rise around the Fibonacci ratio range of 0.5 (120.14) ~ 0.618 (127.46).
If not, and it falls, it is expected to touch the M-Signal indicator on the 1M chart.
Accordingly, there is a possibility that it will touch around 104.75.
-
(1D chart)
The key is whether it can rise above 121.82-123.90 and receive support.
If not,
1st: Fibonacci ratio 0.382 (113.42)
2nd: 104.75
You need to check whether it is supported near the 1st and 2nd above.
At this time, the important thing is whether the price can be maintained above the M-Signal indicator of the 1M chart.
If it falls below the M-Signal indicator of the 1M chart and remains, it is likely to turn into a downtrend, so be careful when trading.
-
Thank you for reading to the end.
I hope you have a successful trade.
--------------------------------------------------
※ Follow X to check out the posts.
※ X를 팔로우하고 게시물을 확인하세요.
◆ t.me/readCryptoChannel
[HA-MS Indicator]
bit.ly/3YxHgvN
[OBV Indicator]
bit.ly/4dcyny3
※ X를 팔로우하고 게시물을 확인하세요.
◆ t.me/readCryptoChannel
[HA-MS Indicator]
bit.ly/3YxHgvN
[OBV Indicator]
bit.ly/4dcyny3
Penafian
Maklumat dan penerbitan adalah tidak dimaksudkan untuk menjadi, dan tidak membentuk, nasihat untuk kewangan, pelaburan, perdagangan dan jenis-jenis lain atau cadangan yang dibekalkan atau disahkan oleh TradingView. Baca dengan lebih lanjut di Terma Penggunaan.