NVDA Weekly Outlook (Oct 28–31): “AI Giant Reawakens — Eyes on $200 Breakout!” ⚙️
1. Weekly (1W) Structure – Macro Strength
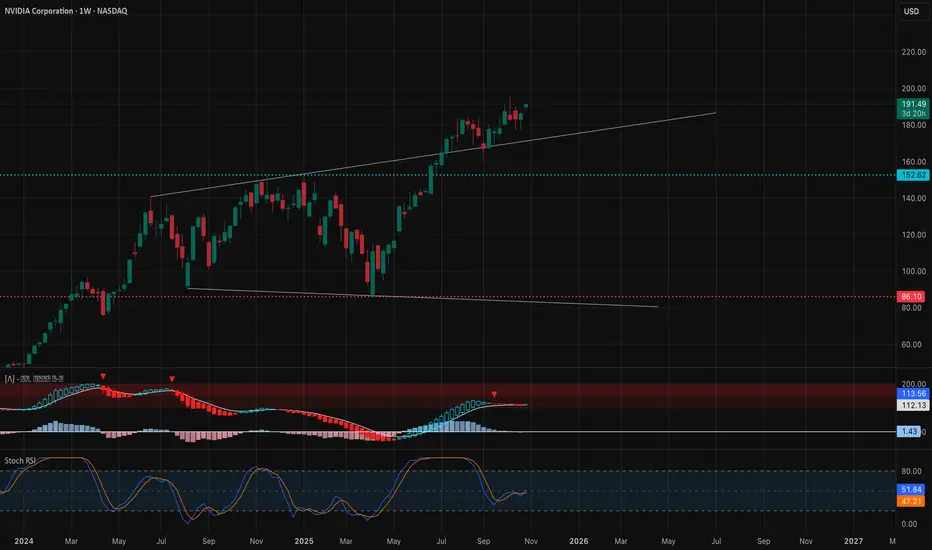
NVIDIA is maintaining a strong bullish structure on the weekly chart, with multiple Breaks of Structure (BOS) confirming sustained institutional demand. After a temporary Change of Character (CHoCH) in September, price reclaimed momentum above $185 and is now pressing toward the $197–$200 resistance zone.
* Bias: Bullish continuation with trend support at $160–$165
* Support: $152 → $160
* Resistance: $197 → $205
* MACD: Steadily positive, histogram expanding — momentum accelerating.
* Stochastic: Trending upward from mid-range — room to push higher.
💡 Weekly Thought: The structure suggests NVDA is forming a strong continuation leg, potentially aiming for a retest of $200–$205 if the AI and semiconductor sector continues its leadership rally.
2. Daily (1D) – Mid-Term Momentum

On the daily chart, NVDA broke out from a corrective CHoCH near $164 and reclaimed the ascending trendline. This move confirms bullish re-entry after testing demand around $170–$175. Price is now nearing the upper boundary of the short-term channel, with potential for a breakout continuation toward $197–$200.
* Bias: Bullish, with trend acceleration visible.
* Support: $184 → $176 (key demand zone)
* Resistance: $197 → $200
* Indicators:
* MACD turning back up after reset — confirming bullish continuation.
* Stochastic RSI crossing up from oversold — aligning with buyer momentum.
💭 Daily Suggestion: Wait for a light pullback to $187–$188 for call entries. If NVDA sustains above $191, expect a grind higher to $197–$200 before month-end.
3. 1-Hour (1H) – Intraday Structure

Intraday structure remains firm. NVDA has printed consecutive BOS patterns with minimal retracements — a hallmark of institutional stepping. The latest CHoCH near $186 acted as a liquidity sweep before pushing higher.
* Scalp Bias: Bullish above $188
* Resistance: $192 → $195 → $197
* Support: $186 → $183
* Setup Idea:
* Call scalp: Above $191 with momentum confirmation; target $195–$197.
* Put scalp: Only valid below $185, targeting $182.
📈 1H Thought: Short-term traders can trail profits on breakouts above $191. Any dip toward $186–$187 may offer strong long opportunities if momentum remains intact.
4. GEX & Options Sentiment – Institutional Positioning

Gamma Exposure (GEX) shows clear bullish call accumulation with the strongest walls around the $190–$200 range.
* Highest positive GEX / resistance: $191.5 → $197 → $200
* Support (put-dominated zones): $187 → $182 → $176
* Call flow: +27.3% net GEX (call-biased)
* IVR: 25 (low-to-neutral)
* IVx avg: 53.8 (slightly elevated volatility window)
Institutional positioning implies a controlled bullish grind — with gamma pinning around $190–$195 that could later expand to $200 if momentum persists.
5. Suggested Option Plays
* Bullish Setup (Preferred):
* Buy-to-open 190C–195C (1DTE/2DTE) on breakout above $191.
* Target: $197–$200
* Stop: Below $186
* Reason: Call concentration above 190 supports continuation move.
* Bearish Hedge:
* Buy 180P (1DTE/2DTE) only if NVDA breaks $185 with volume.
* Target: $177
* Stop: Above $190
NVIDIA’s structure is aligned bullishly across all timeframes — higher lows, consistent BOS patterns, and call-heavy gamma flow all suggest momentum continuation toward $197–$200 before potential consolidation. Short-term traders can look to scalp the $191–$195 zone with calls, while swing traders can hold positions into the breakout channel’s upper range.
🎯 Primary Bias: Bullish toward $200 ⚠️ Watch For: Failing to hold $185 = short-term weakness or sideways phase.
This analysis is for educational purposes only and does not constitute financial advice. Always do your own research and manage your risk before trading.
1. Weekly (1W) Structure – Macro Strength
NVIDIA is maintaining a strong bullish structure on the weekly chart, with multiple Breaks of Structure (BOS) confirming sustained institutional demand. After a temporary Change of Character (CHoCH) in September, price reclaimed momentum above $185 and is now pressing toward the $197–$200 resistance zone.
* Bias: Bullish continuation with trend support at $160–$165
* Support: $152 → $160
* Resistance: $197 → $205
* MACD: Steadily positive, histogram expanding — momentum accelerating.
* Stochastic: Trending upward from mid-range — room to push higher.
💡 Weekly Thought: The structure suggests NVDA is forming a strong continuation leg, potentially aiming for a retest of $200–$205 if the AI and semiconductor sector continues its leadership rally.
2. Daily (1D) – Mid-Term Momentum
On the daily chart, NVDA broke out from a corrective CHoCH near $164 and reclaimed the ascending trendline. This move confirms bullish re-entry after testing demand around $170–$175. Price is now nearing the upper boundary of the short-term channel, with potential for a breakout continuation toward $197–$200.
* Bias: Bullish, with trend acceleration visible.
* Support: $184 → $176 (key demand zone)
* Resistance: $197 → $200
* Indicators:
* MACD turning back up after reset — confirming bullish continuation.
* Stochastic RSI crossing up from oversold — aligning with buyer momentum.
💭 Daily Suggestion: Wait for a light pullback to $187–$188 for call entries. If NVDA sustains above $191, expect a grind higher to $197–$200 before month-end.
3. 1-Hour (1H) – Intraday Structure
Intraday structure remains firm. NVDA has printed consecutive BOS patterns with minimal retracements — a hallmark of institutional stepping. The latest CHoCH near $186 acted as a liquidity sweep before pushing higher.
* Scalp Bias: Bullish above $188
* Resistance: $192 → $195 → $197
* Support: $186 → $183
* Setup Idea:
* Call scalp: Above $191 with momentum confirmation; target $195–$197.
* Put scalp: Only valid below $185, targeting $182.
📈 1H Thought: Short-term traders can trail profits on breakouts above $191. Any dip toward $186–$187 may offer strong long opportunities if momentum remains intact.
4. GEX & Options Sentiment – Institutional Positioning
Gamma Exposure (GEX) shows clear bullish call accumulation with the strongest walls around the $190–$200 range.
* Highest positive GEX / resistance: $191.5 → $197 → $200
* Support (put-dominated zones): $187 → $182 → $176
* Call flow: +27.3% net GEX (call-biased)
* IVR: 25 (low-to-neutral)
* IVx avg: 53.8 (slightly elevated volatility window)
Institutional positioning implies a controlled bullish grind — with gamma pinning around $190–$195 that could later expand to $200 if momentum persists.
5. Suggested Option Plays
* Bullish Setup (Preferred):
* Buy-to-open 190C–195C (1DTE/2DTE) on breakout above $191.
* Target: $197–$200
* Stop: Below $186
* Reason: Call concentration above 190 supports continuation move.
* Bearish Hedge:
* Buy 180P (1DTE/2DTE) only if NVDA breaks $185 with volume.
* Target: $177
* Stop: Above $190
NVIDIA’s structure is aligned bullishly across all timeframes — higher lows, consistent BOS patterns, and call-heavy gamma flow all suggest momentum continuation toward $197–$200 before potential consolidation. Short-term traders can look to scalp the $191–$195 zone with calls, while swing traders can hold positions into the breakout channel’s upper range.
🎯 Primary Bias: Bullish toward $200 ⚠️ Watch For: Failing to hold $185 = short-term weakness or sideways phase.
This analysis is for educational purposes only and does not constitute financial advice. Always do your own research and manage your risk before trading.
Penafian
Maklumat dan penerbitan adalah tidak dimaksudkan untuk menjadi, dan tidak membentuk, nasihat untuk kewangan, pelaburan, perdagangan dan jenis-jenis lain atau cadangan yang dibekalkan atau disahkan oleh TradingView. Baca dengan lebih lanjut di Terma Penggunaan.
Penafian
Maklumat dan penerbitan adalah tidak dimaksudkan untuk menjadi, dan tidak membentuk, nasihat untuk kewangan, pelaburan, perdagangan dan jenis-jenis lain atau cadangan yang dibekalkan atau disahkan oleh TradingView. Baca dengan lebih lanjut di Terma Penggunaan.