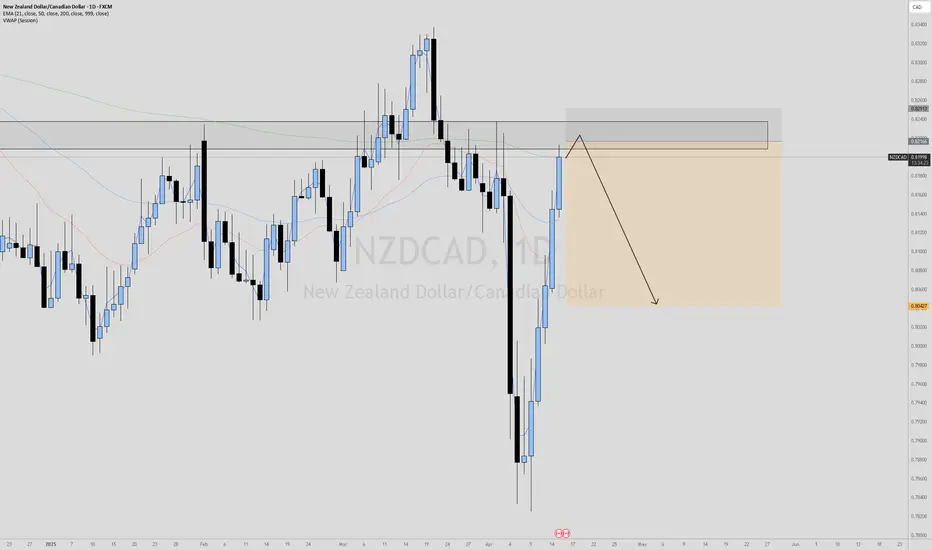
Currency Pair: NZDCAD (New Zealand Dollar / Canadian Dollar)
Timeframe: Daily Chart
Analysis:
The chart shows a strong bearish (downtrend) momentum with lower highs and lower lows, indicating seller control. The price has broken below a significant support level, now acting as resistance. The price has retraced to this resistance, a classic "throwback/pullback" pattern, often seen as a short-selling opportunity. Recent candlesticks show bearish momentum.
Potential Trade Setup:
Entry: Near the resistance level. Look for bearish candlestick patterns for confirmation.
Stop Loss: Above the resistance level.
Target: A previous low or a new lower low.
Additional Considerations:
Consider fundamental factors affecting NZDCAD.
Use proper risk management.
Disclaimer: This is a technical analysis and not financial advice. Trading involves risk. Do your own research.
Penafian
Maklumat dan penerbitan adalah tidak dimaksudkan untuk menjadi, dan tidak membentuk, nasihat untuk kewangan, pelaburan, perdagangan dan jenis-jenis lain atau cadangan yang dibekalkan atau disahkan oleh TradingView. Baca dengan lebih lanjut di Terma Penggunaan.
Penafian
Maklumat dan penerbitan adalah tidak dimaksudkan untuk menjadi, dan tidak membentuk, nasihat untuk kewangan, pelaburan, perdagangan dan jenis-jenis lain atau cadangan yang dibekalkan atau disahkan oleh TradingView. Baca dengan lebih lanjut di Terma Penggunaan.
