Analysis Overview:
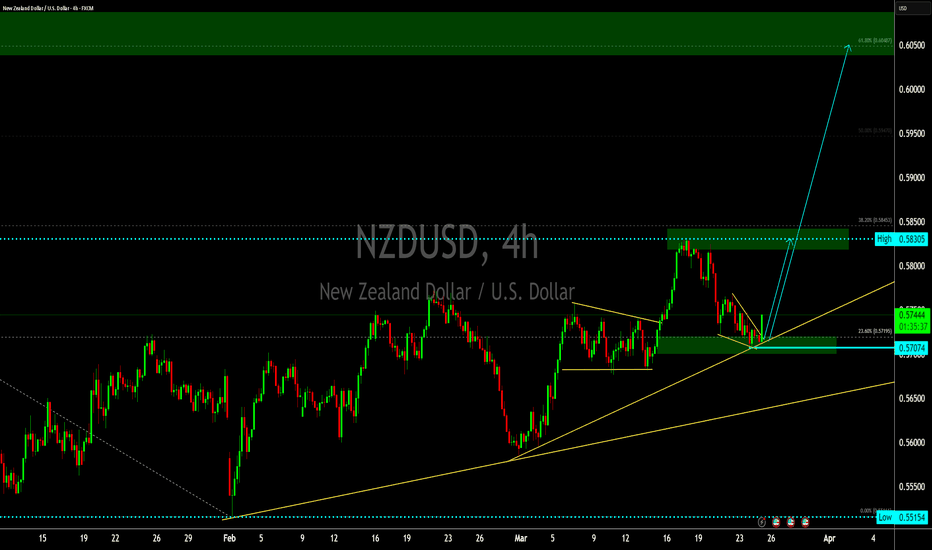
This daily chart of NZD/USD highlights a potential bullish breakout setup based on price action, trendlines, and Fibonacci retracement levels.
Key Technical Elements:
Descending Trendline Breakout:
The price is forming a contracting pattern with a descending trendline.
A breakout above this trendline could signal bullish momentum.
Ascending Support Trendline:
A yellow upward-sloping trendline indicates rising support, suggesting accumulation.
Buyers are stepping in at higher levels.
Fibonacci Retracement Levels:
The chart displays key Fibonacci retracement levels based on the previous downtrend.
The 61.8% Fibonacci retracement level at 0.6048 aligns with a strong resistance zone (marked in green).
Breakout Confirmation:
A label on the chart suggests "Watch for Breakout", indicating a potential bullish move.
If the price successfully breaks above the trendline and the 23.6% Fibonacci level (0.5719), a rally toward the 61.8% zone (0.6048) is likely.
Target Levels:
First target: 0.6048 (61.8% Fibonacci)
Final target: 0.6378 (previous high)
Trading Plan:
Entry: On breakout above the trendline, with confirmation from volume or a strong bullish candle.
Stop-loss: Below recent swing low (~0.5600 area).
Take-profit levels: 0.6048 (main resistance), with an extended target at 0.6378.
Conclusion:
This setup suggests a potential bullish reversal if the breakout is confirmed. Traders should wait for confirmation before entering, ensuring the price does not get rejected at resistance levels.
For Training visit.
Website wave-trader.com
Website techtradingacademy.com
Slack: wavetraders.slack.com
Telegram: t.me/Wavetraders
X: twitter.com/Wave__Trader
FB: facebook.com/WTimran
Website wave-trader.com
Website techtradingacademy.com
Slack: wavetraders.slack.com
Telegram: t.me/Wavetraders
X: twitter.com/Wave__Trader
FB: facebook.com/WTimran
Penafian
Maklumat dan penerbitan adalah tidak dimaksudkan untuk menjadi, dan tidak membentuk, nasihat untuk kewangan, pelaburan, perdagangan dan jenis-jenis lain atau cadangan yang dibekalkan atau disahkan oleh TradingView. Baca dengan lebih lanjut di Terma Penggunaan.

