📉 OBEROI REALTY LTD – Double Bottom but Failed Breakout Retest
📅 Date: April 28, 2025
📈 Timeframe: Daily Chart
🔍 Stock: Oberoi Realty Ltd (NSE)
📌 Technical Overview:
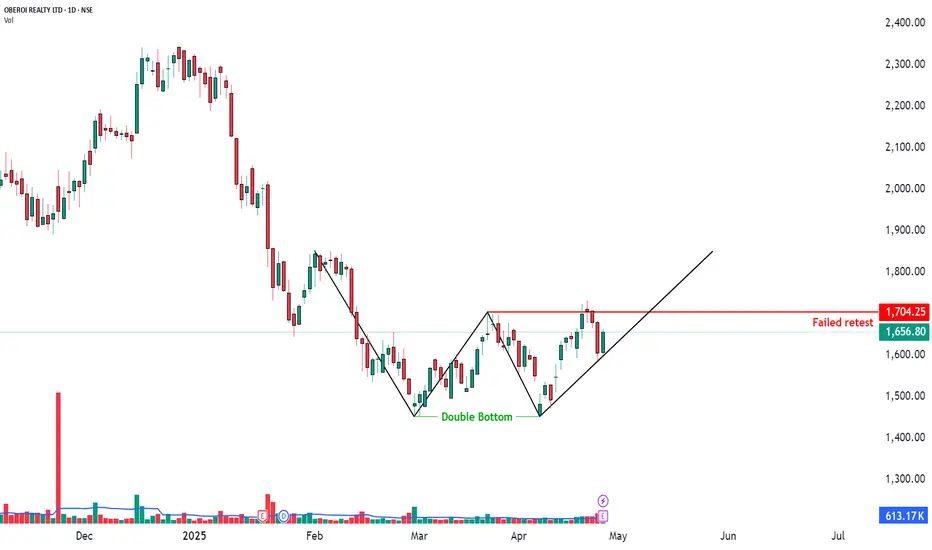
A Double Bottom pattern was formed indicating bullish reversal potential.
Price attempted a breakout above the neckline near ₹1704.25, but the retest failed — price could not sustain above the breakout zone.
Price is currently trading at ₹1656.80, under the trendline support.
🧩 Key Observations:
✅ Double bottom structure was confirmed.
❌ Breakout retest failed — caution needed.
📉 Watch trendline support (black line) closely — breakdown could trigger weakness.
📊 Volume during the failure was moderate (not aggressive selling yet).
🧠 Observational Bias:
Weak below the trendline support.
Bulls must reclaim and hold above ₹1704.25 to regain strength.
📅 Date: April 28, 2025
📈 Timeframe: Daily Chart
🔍 Stock: Oberoi Realty Ltd (NSE)
📌 Technical Overview:
A Double Bottom pattern was formed indicating bullish reversal potential.
Price attempted a breakout above the neckline near ₹1704.25, but the retest failed — price could not sustain above the breakout zone.
Price is currently trading at ₹1656.80, under the trendline support.
🧩 Key Observations:
✅ Double bottom structure was confirmed.
❌ Breakout retest failed — caution needed.
📉 Watch trendline support (black line) closely — breakdown could trigger weakness.
📊 Volume during the failure was moderate (not aggressive selling yet).
🧠 Observational Bias:
Weak below the trendline support.
Bulls must reclaim and hold above ₹1704.25 to regain strength.
Dagangan aktif
Trailing @ 1775Nota
Keep Trailing on DCBSTWP | Mentor & Demand-Supply Specialist | Empowering traders through structured learning |
simpletradewithpatience.com
Community: chat.whatsapp.com/BEYz0tkqP0fJPBCWf59uel
wa.me/message/6IOPHGOXMGZ4N1
Educational Only
simpletradewithpatience.com
Community: chat.whatsapp.com/BEYz0tkqP0fJPBCWf59uel
wa.me/message/6IOPHGOXMGZ4N1
Educational Only
Penafian
Maklumat dan penerbitan adalah tidak bertujuan, dan tidak membentuk, nasihat atau cadangan kewangan, pelaburan, dagangan atau jenis lain yang diberikan atau disahkan oleh TradingView. Baca lebih dalam Terma Penggunaan.
STWP | Mentor & Demand-Supply Specialist | Empowering traders through structured learning |
simpletradewithpatience.com
Community: chat.whatsapp.com/BEYz0tkqP0fJPBCWf59uel
wa.me/message/6IOPHGOXMGZ4N1
Educational Only
simpletradewithpatience.com
Community: chat.whatsapp.com/BEYz0tkqP0fJPBCWf59uel
wa.me/message/6IOPHGOXMGZ4N1
Educational Only
Penafian
Maklumat dan penerbitan adalah tidak bertujuan, dan tidak membentuk, nasihat atau cadangan kewangan, pelaburan, dagangan atau jenis lain yang diberikan atau disahkan oleh TradingView. Baca lebih dalam Terma Penggunaan.