⚡ OLECTRA – Wave C Completion Zone Hit | Is a Strong Reversal & Wave C Rally Coming?
🧠 Overall Chart Context
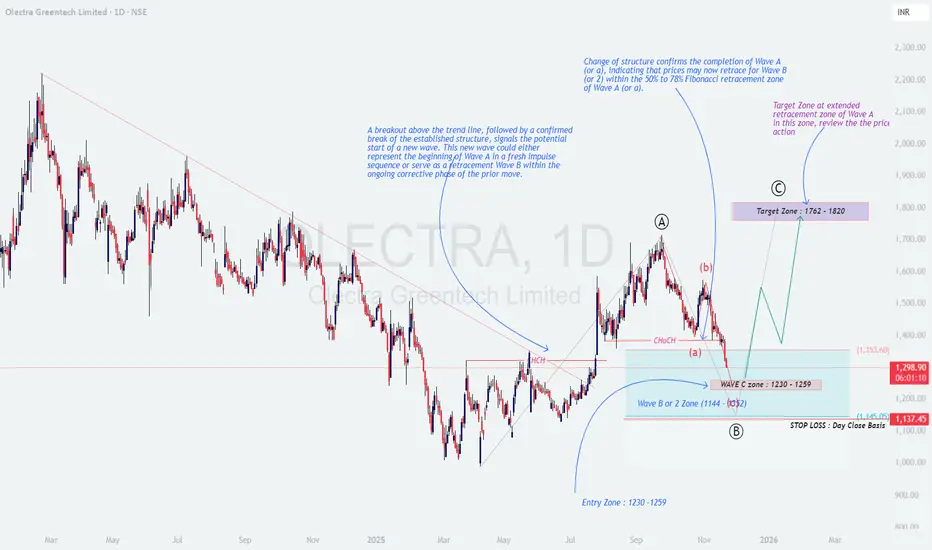
The chart of Olectra Greentech Ltd (1D) shows a well-defined Elliott Wave corrective structure, where price has now entered the expected Wave C completion zone (₹1230–₹1259).
This zone aligns with strong demand + Fibonacci confluence, suggesting a potential end of Wave B/2 and the beginning of a new Wave C impulse.
📌 Price previously made:
A clean Change of Character (ChoCH) → signaling completion of Wave A.
A retracement to the 50–78% retracement zone → forming Wave (b).
A steady fall into Wave C demand zone → now approaching support.
📚 Educational Insights
🎯 Prediction & Targets
If OLECTRA sustains above the ₹1230–₹1259 support zone, a new Wave C rally may unfold.
🎯 First Profit Zone: ₹1,760 – ₹1,820
🎯 Extended Target: ₹1,900+ (if momentum continues)
🛑 Stop Loss: Close below ₹1,137 (invalidates Wave B/2 structure)
💡 Trading Strategy (Educational Purpose Only)
🧩 Summary & Outlook
OLECTRA has entered the crucial Wave C completion zone, which is a high-probability reversal area.
If momentum builds from this demand zone, price may begin a fresh Wave C impulse, aiming for ₹1760–₹1820 in the coming weeks.
A breakout above ₹1353 will act as the early confirmation trigger 🔥.
⚠️ Disclaimer
I am not a SEBI-registered analyst.
This analysis is for educational purposes only — not investment advice.
🧠 Overall Chart Context
The chart of Olectra Greentech Ltd (1D) shows a well-defined Elliott Wave corrective structure, where price has now entered the expected Wave C completion zone (₹1230–₹1259).
This zone aligns with strong demand + Fibonacci confluence, suggesting a potential end of Wave B/2 and the beginning of a new Wave C impulse.
📌 Price previously made:
A clean Change of Character (ChoCH) → signaling completion of Wave A.
A retracement to the 50–78% retracement zone → forming Wave (b).
A steady fall into Wave C demand zone → now approaching support.
📚 Educational Insights
- 📘 Change of Structure (ChoCH):
A confirmed break of previous swing highs indicates the first shift from bearish to bullish structure — often the start of new wave formation. - ✨ Wave A–B–C Corrections:
Wave B typically retraces 50–78% of Wave A, while Wave C often equals Wave A in size. This structure is playing out perfectly here. - 🌀 Extended Retracement Zones:
When prices fall into strong demand (like ₹1230–₹1260), these zones often create big reversal opportunities in impulsive markets.
🎯 Prediction & Targets
If OLECTRA sustains above the ₹1230–₹1259 support zone, a new Wave C rally may unfold.
🎯 First Profit Zone: ₹1,760 – ₹1,820
🎯 Extended Target: ₹1,900+ (if momentum continues)
🛑 Stop Loss: Close below ₹1,137 (invalidates Wave B/2 structure)
💡 Trading Strategy (Educational Purpose Only)
- 🟢 Entry Zone: ₹1230–₹1259
Wait for reversal candles (hammer, engulfing) or a bullish ChoCH on lower timeframes. - 📈 Confirmation:
A break above ₹1,353 strengthens the probability of Wave C starting. - 🎯 Targets:
• First Target → ₹1762–₹1820
• Extended Target → ₹1900+ - ⚖️ Risk Plan:
Risk only 1–2% of capital.
Stick to closing-basis SL at ₹1,137.
🧩 Summary & Outlook
OLECTRA has entered the crucial Wave C completion zone, which is a high-probability reversal area.
If momentum builds from this demand zone, price may begin a fresh Wave C impulse, aiming for ₹1760–₹1820 in the coming weeks.
A breakout above ₹1353 will act as the early confirmation trigger 🔥.
⚠️ Disclaimer
I am not a SEBI-registered analyst.
This analysis is for educational purposes only — not investment advice.
Penafian
The information and publications are not meant to be, and do not constitute, financial, investment, trading, or other types of advice or recommendations supplied or endorsed by TradingView. Read more in the Terms of Use.
Penafian
The information and publications are not meant to be, and do not constitute, financial, investment, trading, or other types of advice or recommendations supplied or endorsed by TradingView. Read more in the Terms of Use.