🔍 Chart Setup & Trend
Timeframe: Daily chart
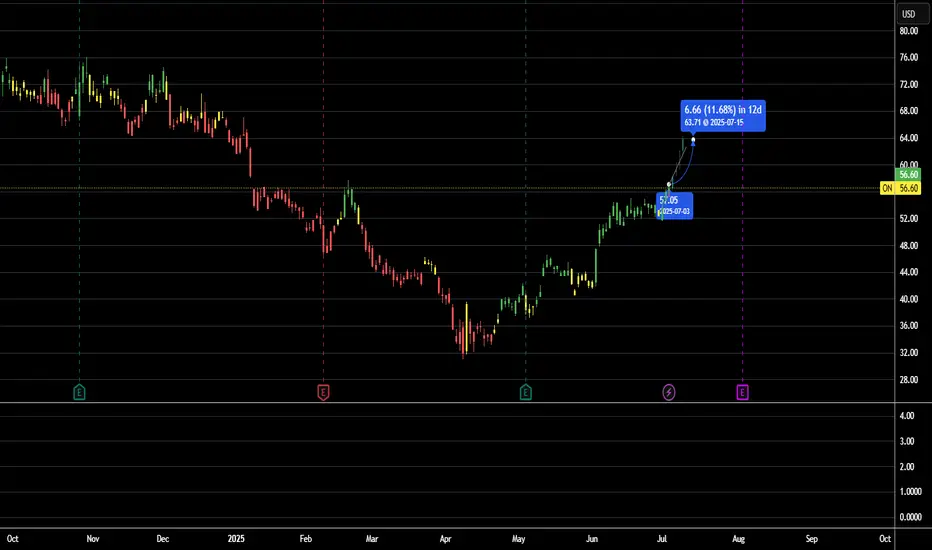
Trend: After a prolonged downtrend, ON appears to be forming a base and attempting a short-term reversal.
It is testing resistance around $57, and a breakout could trigger bullish continuation.
Price is approaching the 50-day EMA, which is a key level to watch for confirmation.
📊 Key Indicators
RSI: ~52
↳ Neutral, but trending upward. Room to grow before hitting overbought levels.
MACD: Bullish crossover just occurred
↳ Momentum is shifting in favor of the bulls.
Volume: Modest uptick on green days—sign of early accumulation.
🔧 Support & Resistance
Immediate support: $54.80 (recent swing low)
Resistance 1: $57.00 (current test level)
Resistance 2: $60.00
12% Target Price: $63.40
🎯 Trade Plan (Short-Term Swing)
Entry Zone: $56.60–$57.10 (on confirmed breakout)
Price Target (12% gain): $63.40
Stop-loss: $53.90 (below recent low and EMA20)
Risk/Reward Ratio: ~1:2 or better depending on entry
Timeframe: Daily chart
Trend: After a prolonged downtrend,
It is testing resistance around $57, and a breakout could trigger bullish continuation.
Price is approaching the 50-day EMA, which is a key level to watch for confirmation.
📊 Key Indicators
RSI: ~52
↳ Neutral, but trending upward. Room to grow before hitting overbought levels.
MACD: Bullish crossover just occurred
↳ Momentum is shifting in favor of the bulls.
Volume: Modest uptick on green days—sign of early accumulation.
🔧 Support & Resistance
Immediate support: $54.80 (recent swing low)
Resistance 1: $57.00 (current test level)
Resistance 2: $60.00
12% Target Price: $63.40
🎯 Trade Plan (Short-Term Swing)
Entry Zone: $56.60–$57.10 (on confirmed breakout)
Price Target (12% gain): $63.40
Stop-loss: $53.90 (below recent low and EMA20)
Risk/Reward Ratio: ~1:2 or better depending on entry
Penafian
Maklumat dan penerbitan adalah tidak dimaksudkan untuk menjadi, dan tidak membentuk, nasihat untuk kewangan, pelaburan, perdagangan dan jenis-jenis lain atau cadangan yang dibekalkan atau disahkan oleh TradingView. Baca dengan lebih lanjut di Terma Penggunaan.
Penafian
Maklumat dan penerbitan adalah tidak dimaksudkan untuk menjadi, dan tidak membentuk, nasihat untuk kewangan, pelaburan, perdagangan dan jenis-jenis lain atau cadangan yang dibekalkan atau disahkan oleh TradingView. Baca dengan lebih lanjut di Terma Penggunaan.