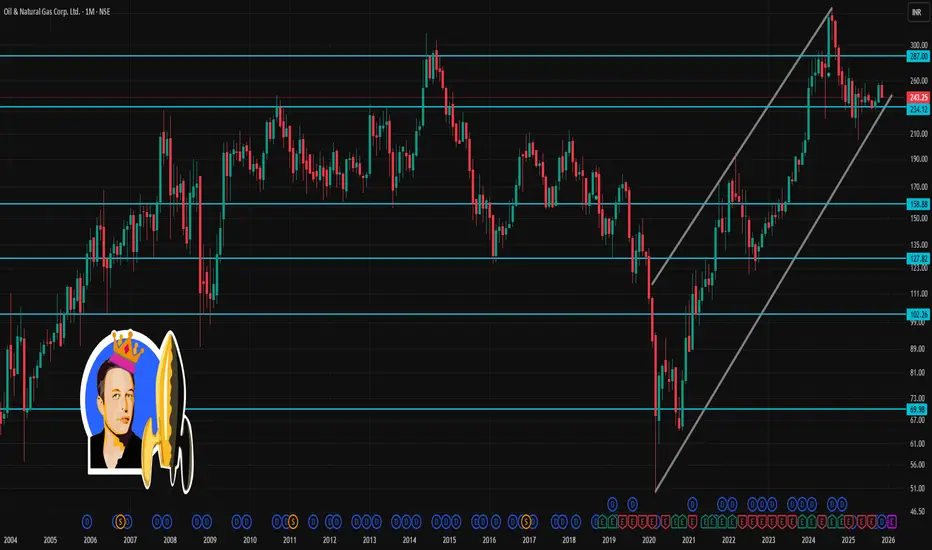
📌 Current snapshot
ONGC last traded around ₹243–₹244.
Over the past month, the stock has dropped ~3–4%.
📈 What could happen in next month
Bearish scenario: If price slips below ₹241 and sentiment (oil prices, global energy demand, investor flows) remains weak — ONGC could test the lower support zone around ₹238–₹240.
Neutral / range-bound: The stock could hover between ₹241–₹251, especially if crude/oil-sector news remains mixed, or broader market is choppy.
Bullish scenario: If ONGC closes above ~₹251 with supportive macro (oil prices, global demand, corporate news) — next leg could push it towards ₹255–₹257 (near-term target).
Penerbitan berkaitan
Penafian
Maklumat dan penerbitan adalah tidak bertujuan, dan tidak membentuk, nasihat atau cadangan kewangan, pelaburan, dagangan atau jenis lain yang diberikan atau disahkan oleh TradingView. Baca lebih dalam Terma Penggunaan.
Penerbitan berkaitan
Penafian
Maklumat dan penerbitan adalah tidak bertujuan, dan tidak membentuk, nasihat atau cadangan kewangan, pelaburan, dagangan atau jenis lain yang diberikan atau disahkan oleh TradingView. Baca lebih dalam Terma Penggunaan.