1. Fibonacci Analysis
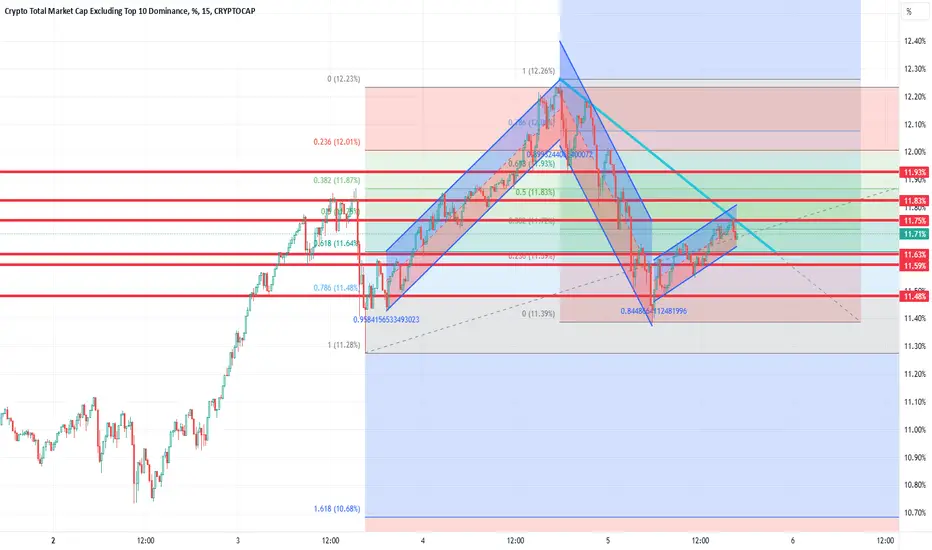
Fibonacci retracement and extension levels are clearly visible, which help identify potential reversal and target points.
Key Retracement Levels (0.618 and 0.786): These levels often act as strong support during pullbacks. The price seems to have bounced back from this zone.
Fibonacci Extension Levels (1.272 and 1.618): These levels act as resistance zones and potential price targets. The 1.272 level (~12.00) is a key resistance to watch.
The price is currently consolidating above the 0.618 level, which might indicate bullish momentum building up.
2. Chart Pattern
The trend lines suggest the formation of a falling wedge or symmetrical triangle pattern:
Symmetrical Triangle: Price is compressing within this pattern, suggesting an upcoming breakout.
Upward Breakout: The target could be around 12.00 or higher.
Downward Breakout: Support levels around 11.40 or lower might come into play.
This pattern is nearing its breakout point, making the next few movements crucial.
3. Support and Resistance Levels
Key levels of interest:
Support Levels:
11.50: A strong support level where the price has bounced multiple times.
11.20 - 11.30: This zone coincides with the 0.786 Fibonacci level, making it a critical area.
Resistance Levels:
11.90 - 12.00: This is a crucial resistance zone aligned with the 1.272 Fibonacci extension.
12.20 - 12.50: A longer-term resistance area if the price breaks upward.
4. Volume Analysis
The volume levels beneath the chart should be closely monitored:
Rising Volume + Breakout: Indicates a strong move in the breakout direction.
Low Volume + Breakout: May result in a false breakout.
5. Market Trend (Overall Direction)
Short-Term Trend: Currently ranging. The price must break the triangle/wedge pattern for a clearer direction.
Medium-Term Trend: Upward momentum is visible, but resistance zones are limiting further gains.
Long-Term Trend: If an upward breakout occurs, it could signify the continuation of a bullish trend. However, a downward breakout may lead to bearish pressure.
6. Strategic Outlook
Bullish Scenario:
If the price breaks above 11.90–12.00, we could see targets of 12.50 and beyond.
Bearish Scenario:
If the price falls below 11.50, the next support zones to watch are 11.20 and 11.00.
Conclusion
The chart reflects a critical consolidation phase, where the price could break out in either direction.
Fibonacci levels and the triangle formation suggest that the market is preparing for a significant move.
Upward breakout targets: 12.00 and above.
Downward breakout targets: 11.20 and lower.
Penafian
Maklumat dan penerbitan adalah tidak dimaksudkan untuk menjadi, dan tidak membentuk, nasihat untuk kewangan, pelaburan, perdagangan dan jenis-jenis lain atau cadangan yang dibekalkan atau disahkan oleh TradingView. Baca dengan lebih lanjut di Terma Penggunaan.
Penafian
Maklumat dan penerbitan adalah tidak dimaksudkan untuk menjadi, dan tidak membentuk, nasihat untuk kewangan, pelaburan, perdagangan dan jenis-jenis lain atau cadangan yang dibekalkan atau disahkan oleh TradingView. Baca dengan lebih lanjut di Terma Penggunaan.