**Hello dear altcoin degens, HODL-ers, and traders,**
How are you doing this Saturday? I hope you’re enjoying the weekend in your own unique way!
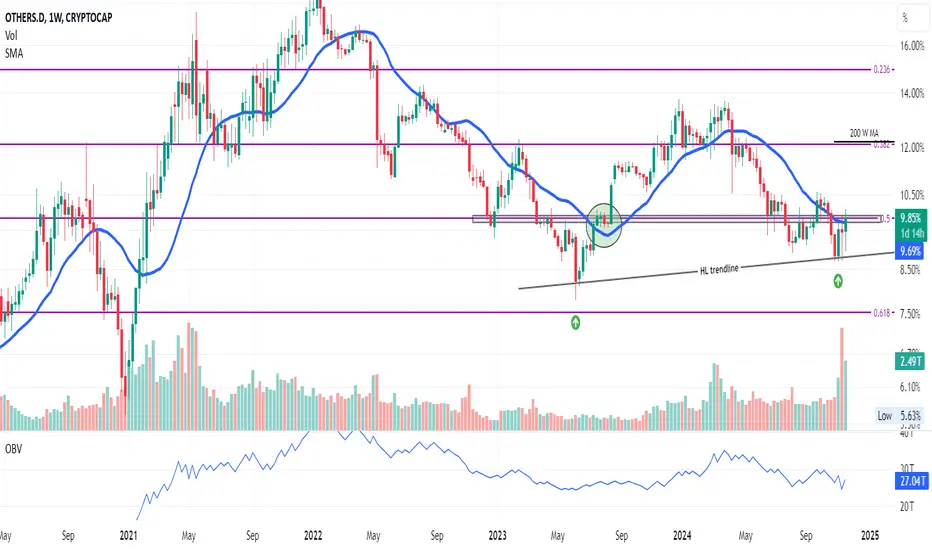
This is **OTHERS.D**, the index representing the market cap of altcoins outside the top 10. On the weekly time frame, there are several key points of interest that could help us analyze what might happen next. However, as always in trading, nothing should be taken for granted.
**Key Observations**
1. **Higher Lows Trendline:**
- We can clearly see a series of higher lows, starting with the bottom formed during the week of **June 5, 2023**, and another higher low during the week of **October 28, 2024**. This upward trendline is a promising signal for the altcoin market.
2. **The Role of the 21MA (Moving Average):**
- Historically, the 21MA has acted as a reliable support level before price moves higher, as seen between **July 17,2023** and **August 7, 2024** (highlighted with a green circle).
- Currently, the price is trading above this 21MA, which is an encouraging sign.
3. **The Critical 50% Fibonacci Level:**
- The 50% Fib retracement level has historically been significant. The green circle highlights how this level previously served as the launchpad for an upward move.
- At present, the price is trying to break through this level, which is acting as resistance.
**Combining Support Factors**
When we combine the **21MA** and the **50% Fibonacci level**, we get an area of strong support/resistance. For now, the price is attempting to break through this resistance zone.
**What’s Next?**
- If the weekly candle closes **above this critical area**, it’s a bullish signal and great news for those hunting the elusive **altseason**!
- Until then, we wait. The weekly close will provide more clarity, and based on the outcome, we can decide on the next course of action.
**Final Note**
Patience is key in this game. Stay safe, and let’s see how this plays out!
How are you doing this Saturday? I hope you’re enjoying the weekend in your own unique way!
This is **OTHERS.D**, the index representing the market cap of altcoins outside the top 10. On the weekly time frame, there are several key points of interest that could help us analyze what might happen next. However, as always in trading, nothing should be taken for granted.
**Key Observations**
1. **Higher Lows Trendline:**
- We can clearly see a series of higher lows, starting with the bottom formed during the week of **June 5, 2023**, and another higher low during the week of **October 28, 2024**. This upward trendline is a promising signal for the altcoin market.
2. **The Role of the 21MA (Moving Average):**
- Historically, the 21MA has acted as a reliable support level before price moves higher, as seen between **July 17,2023** and **August 7, 2024** (highlighted with a green circle).
- Currently, the price is trading above this 21MA, which is an encouraging sign.
3. **The Critical 50% Fibonacci Level:**
- The 50% Fib retracement level has historically been significant. The green circle highlights how this level previously served as the launchpad for an upward move.
- At present, the price is trying to break through this level, which is acting as resistance.
**Combining Support Factors**
When we combine the **21MA** and the **50% Fibonacci level**, we get an area of strong support/resistance. For now, the price is attempting to break through this resistance zone.
**What’s Next?**
- If the weekly candle closes **above this critical area**, it’s a bullish signal and great news for those hunting the elusive **altseason**!
- Until then, we wait. The weekly close will provide more clarity, and based on the outcome, we can decide on the next course of action.
**Final Note**
Patience is key in this game. Stay safe, and let’s see how this plays out!
Penerbitan berkaitan
Penafian
Maklumat dan penerbitan adalah tidak dimaksudkan untuk menjadi, dan tidak membentuk, nasihat untuk kewangan, pelaburan, perdagangan dan jenis-jenis lain atau cadangan yang dibekalkan atau disahkan oleh TradingView. Baca dengan lebih lanjut di Terma Penggunaan.
Penerbitan berkaitan
Penafian
Maklumat dan penerbitan adalah tidak dimaksudkan untuk menjadi, dan tidak membentuk, nasihat untuk kewangan, pelaburan, perdagangan dan jenis-jenis lain atau cadangan yang dibekalkan atau disahkan oleh TradingView. Baca dengan lebih lanjut di Terma Penggunaan.