📌 Overview
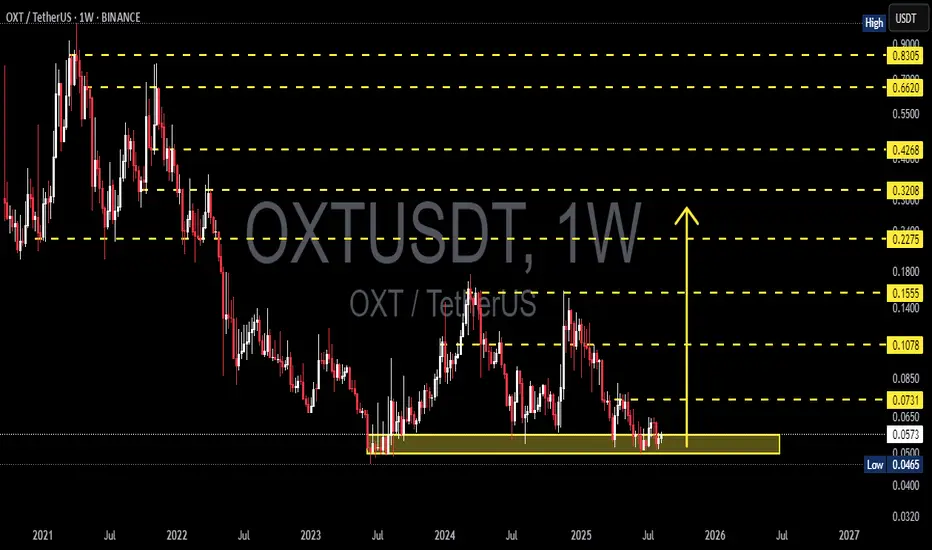
OXT/USDT is currently at a critical stage on the weekly chart, consolidating within the strong demand zone at 0.0465–0.0650 (yellow box) that has been tested multiple times since mid-2023. This area acts as the last line of defense for buyers before price enters uncharted multi-year lows. The macro structure remains in a long-term downtrend since the 2021 peak, but the base formation in this low zone opens up a significant opportunity for a medium-term relief rally if a breakout is confirmed.
---
1. Key Technical Levels
Main Support / Demand Zone (yellow box): 0.0465 – 0.0650
→ This is the “floor” that has been holding price for nearly two years.
Minor Support: 0.0500 (psychological & repeated reaction level)
Layered Resistance Levels:
0.0731 → 0.1078 → 0.1555 → 0.2275 → 0.3208 → 0.4268 → 0.6620 → 0.8305
---
2. Structure & Patterns
Macro Trend: A sequence of lower highs since 2021 → indicating the primary trend is still bearish.
Potential Pattern:
Base / Accumulation Range near multi-year lows → resembles an early rounding bottom, but not confirmed yet.
Possible spring pattern: brief drop below main support followed by a sharp reclaim.
Volume (not shown here): Often decreases near the bottom range, signaling sellers may be losing strength.
---
3. Bullish Scenario (Relief Rally Potential)
💡 Conservative confirmation:
Break & weekly close above 0.0731.
Step-by-step targets: 0.1078 → 0.1555 → 0.2275.
0.1078 is the key breakout pivot; clearing it could trigger large-scale short covering.
⚡ Aggressive setup:
False breakdown below 0.0465 (spring) followed by a quick weekly close back above 0.050–0.055.
Initial target: 0.0650, then 0.0731 if momentum continues.
Best suited for swing traders aiming for high risk/reward.
---
4. Bearish Scenario (Trend Continuation)
Clean weekly close below 0.0465 + failed retest (0.0465 turning into resistance).
Downside targets: 0.0400 then 0.0320.
Failure to break 0.0731 and forming another lower high would also indicate sellers remain in control.
---
5. Strategic Notes
The 0.0465–0.0650 zone is the final battleground between long-term buyers and sellers controlling the macro trend.
Patience is required on this 1W timeframe; valid breakouts may take several weekly candles to confirm.
Aggressive traders may consider entries within the yellow box with tight stops below 0.0465, while conservative traders can wait for a confirmed breakout above key resistance.
---
6. Key Takeaway
As long as price holds inside or above the yellow box, relief rally potential remains alive.
Breaking 0.0731 will be the first major signal of sentiment shift.
A breakdown below 0.0465 opens a new chapter in the long-term downtrend.
#OXT #OXTUSDT #OrchidProtocol #CryptoAnalysis #PriceAction #WeeklyChart #SwingTrade #SupportResistance #BreakoutSetup #CryptoTrading
✅ Get Free Signals! Join Our Telegram Channel Here: t.me/TheCryptoNuclear
✅ Twitter: twitter.com/crypto_nuclear
✅ Join Bybit : partner.bybit.com/b/nuclearvip
✅ Benefits : Lifetime Trading Fee Discount -50%
✅ Twitter: twitter.com/crypto_nuclear
✅ Join Bybit : partner.bybit.com/b/nuclearvip
✅ Benefits : Lifetime Trading Fee Discount -50%
Penafian
The information and publications are not meant to be, and do not constitute, financial, investment, trading, or other types of advice or recommendations supplied or endorsed by TradingView. Read more in the Terms of Use.