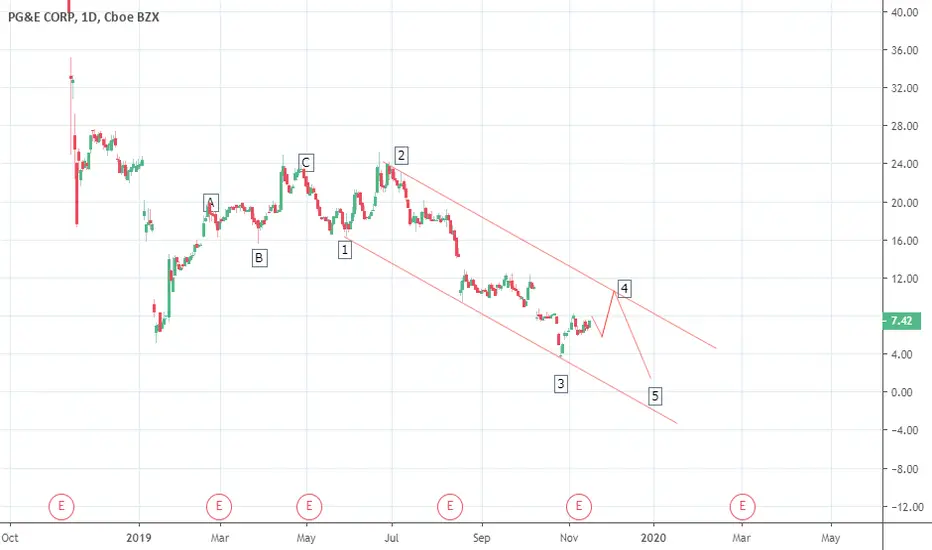
After my daily stare at the PCG chart, I noticed that the low from January to the high in April was in 3 waves, and fits with a classic zigzag, but then there was some sideways movement afterwards. This could be sideways consolidation as part of the corrective move up from January lows. Or it could be a 1-2 as part of the down move that started as shown in the chart.
It's always important to keep an open mind. I believe this chart makes the most sense from a long to medium term stand point. If that is the case, then we are currently in wave 4 of this down move and will retrace to 10 area before falling below 3.
Also this current bounce is a lot weaker than Januarys bounce so I don't see us getting past 11 by the end of the year.
Penafian
Maklumat dan penerbitan adalah tidak dimaksudkan untuk menjadi, dan tidak membentuk, nasihat untuk kewangan, pelaburan, perdagangan dan jenis-jenis lain atau cadangan yang dibekalkan atau disahkan oleh TradingView. Baca dengan lebih lanjut di Terma Penggunaan.
Penafian
Maklumat dan penerbitan adalah tidak dimaksudkan untuk menjadi, dan tidak membentuk, nasihat untuk kewangan, pelaburan, perdagangan dan jenis-jenis lain atau cadangan yang dibekalkan atau disahkan oleh TradingView. Baca dengan lebih lanjut di Terma Penggunaan.