Overview
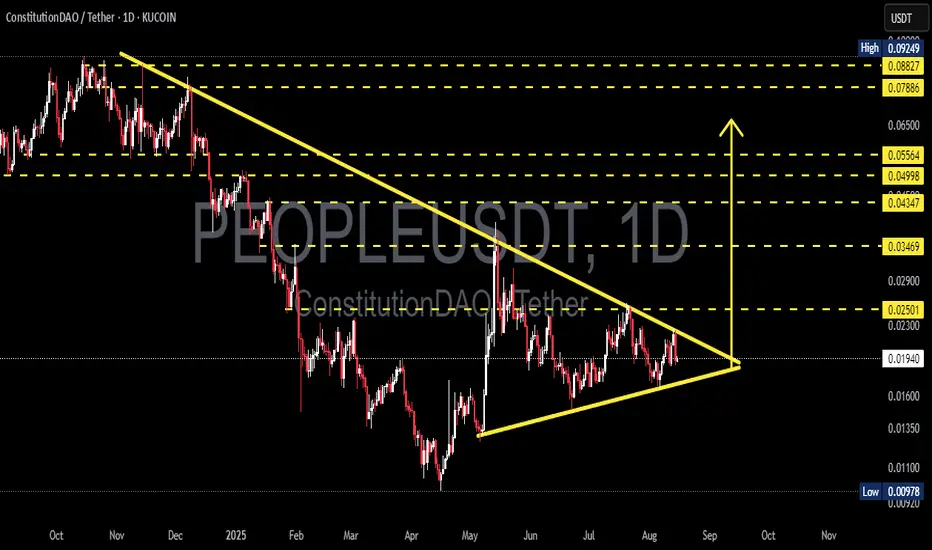
Structure: Symmetrical Triangle — a long-term descending trendline (lower highs) converging with an ascending trendline (higher lows) since May. Volatility is tightening as price approaches the apex (late August–early September).
Current Price: ± 0.0194
Key Levels:
Resistance: 0.0230 → 0.0250 → 0.0290 → 0.0347 → 0.0435
Support: rising trendline (~0.018–0.0185) → 0.0160 → 0.0135 → 0.0110 → 0.0098 (YTD low)
---
Pattern Details
Symmetrical Triangle formed by a descending supply line connecting lower highs from Q4 2024 and an ascending demand line from the May 2025 swing low.
This is a neutral pattern — direction can go either way, with probabilities close to 50/50. Breakout confirmation requires a daily close outside the triangle with increased volume.
Measured move: the initial triangle height is ~0.012–0.014. Adding/subtracting this from the breakout point gives a projected move to:
Upside target: ~0.033–0.035 (aligning with 0.0347 resistance)
Downside target: ~0.007–0.010 (aligning with 0.0098 support zone)
---
Bullish Scenario
Trigger:
Daily close above the upper trendline (~0.021–0.022) with strong volume
Possible Path & Targets:
1. 0.0230 (first retest)
2. 0.0250 (minor supply)
3. 0.0290 (major resistance)
4. 0.0347 (measured move target & key historical resistance)
5. Extended run: 0.0435 if momentum continues
Invalidation: close back below 0.021 after breakout. Stop-loss often set just below breakout retest.
---
Bearish Scenario
Trigger:
Daily close below the lower trendline (~0.018–0.0185) with strong volume
Possible Path & Targets:
1. 0.0160
2. 0.0135
3. 0.0110
4. 0.0098 (low; break here could open room to 0.007–0.010 range per measured move)
Invalidation: close back above 0.0185 after a downside break.
---
Trade Notes & Risk Management
Symmetrical triangles typically break between two-thirds and three-quarters of the way to the apex — we are currently near that zone. Waiting for confirmation is safer than guessing direction.
Prefer the break–retest–go approach over chasing the first breakout candle.
Use laddered take-profit at horizontal levels and keep risk ≤1–2% per trade.
Be aware of fakeouts near the apex — volume is a key filter.
#PEOPLE #PEOPLEUSDT #ConstitutionDAO #TrianglePattern #SymmetricalTriangle #Breakout #PriceAction #CryptoTA #Altcoin #SupportResistance
✅ Get Free Signals! Join Our Telegram Channel Here: t.me/TheCryptoNuclear
✅ Twitter: twitter.com/crypto_nuclear
✅ Join Bybit : partner.bybit.com/b/nuclearvip
✅ Benefits : Lifetime Trading Fee Discount -50%
✅ Twitter: twitter.com/crypto_nuclear
✅ Join Bybit : partner.bybit.com/b/nuclearvip
✅ Benefits : Lifetime Trading Fee Discount -50%
Penafian
Maklumat dan penerbitan adalah tidak dimaksudkan untuk menjadi, dan tidak membentuk, nasihat untuk kewangan, pelaburan, perdagangan dan jenis-jenis lain atau cadangan yang dibekalkan atau disahkan oleh TradingView. Baca dengan lebih lanjut di Terma Penggunaan.