PepsiCo (PEP) Shares Jump Over 4% After Earnings Report — What’s Next?
Yesterday, PepsiCo Inc. (PEP) released its quarterly earnings report, which significantly exceeded expectations:
→ Earnings per share ($2.29) beat estimates of $2.26.
→ Gross revenue ($23.94 billion) also came in above forecasts of $23.94 billion.
According to The Wall Street Journal, PepsiCo will have a new Chief Financial Officer in a month — Steve Schmitt, a senior executive from Walmart. Analysts suggest that this leadership change could give the company a fresh boost, particularly as it continues to face challenges with sales growth, reflected in a months-long downtrend in its share price.

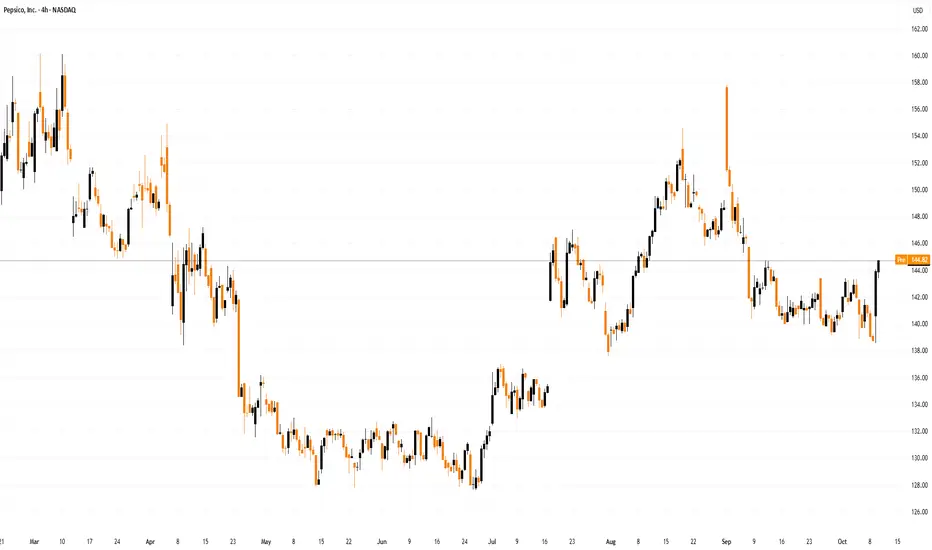
Technical Analysis of the PEP Chart
The PepsiCo share chart clearly highlights a disappointing trend, illustrated by the red descending channel.
However, there are signs that the situation could be shifting — and here’s why:
→ In May–June, the chart formed a relatively narrow range, which may reflect accumulation by large market participants who saw value in the stock at lower levels and began building long positions near a key psychological mark.
→ Between July and September, the share price rose from $130 to $150, suggesting a shift in market sentiment and indicating that institutional investors may have taken bullish positions.
While the long upper shadows above the $150 level reveal aggressive selling pressure, there are solid reasons for optimism:
→ PEP price movements suggest that the stock is attempting a bullish breakout above the upper boundary of the red descending channel;
→ as shown by the arrow, yesterday the price created a bear trap — dipping to a two-month low before rebounding sharply;
→ this could indicate that large players have shifted their control zone upwards, from $130 to $140.
If the bullish outlook proves correct, we could see price action developing within an upward channel (shown in blue), with the key resistance level for the bulls remaining near the psychological $150 mark.
This article represents the opinion of the Companies operating under the FXOpen brand only. It is not to be construed as an offer, solicitation, or recommendation with respect to products and services provided by the Companies operating under the FXOpen brand, nor is it to be considered financial advice.
Yesterday, PepsiCo Inc. (PEP) released its quarterly earnings report, which significantly exceeded expectations:
→ Earnings per share ($2.29) beat estimates of $2.26.
→ Gross revenue ($23.94 billion) also came in above forecasts of $23.94 billion.
According to The Wall Street Journal, PepsiCo will have a new Chief Financial Officer in a month — Steve Schmitt, a senior executive from Walmart. Analysts suggest that this leadership change could give the company a fresh boost, particularly as it continues to face challenges with sales growth, reflected in a months-long downtrend in its share price.
Technical Analysis of the PEP Chart
The PepsiCo share chart clearly highlights a disappointing trend, illustrated by the red descending channel.
However, there are signs that the situation could be shifting — and here’s why:
→ In May–June, the chart formed a relatively narrow range, which may reflect accumulation by large market participants who saw value in the stock at lower levels and began building long positions near a key psychological mark.
→ Between July and September, the share price rose from $130 to $150, suggesting a shift in market sentiment and indicating that institutional investors may have taken bullish positions.
While the long upper shadows above the $150 level reveal aggressive selling pressure, there are solid reasons for optimism:
→ PEP price movements suggest that the stock is attempting a bullish breakout above the upper boundary of the red descending channel;
→ as shown by the arrow, yesterday the price created a bear trap — dipping to a two-month low before rebounding sharply;
→ this could indicate that large players have shifted their control zone upwards, from $130 to $140.
If the bullish outlook proves correct, we could see price action developing within an upward channel (shown in blue), with the key resistance level for the bulls remaining near the psychological $150 mark.
This article represents the opinion of the Companies operating under the FXOpen brand only. It is not to be construed as an offer, solicitation, or recommendation with respect to products and services provided by the Companies operating under the FXOpen brand, nor is it to be considered financial advice.
Penafian
Maklumat dan penerbitan adalah tidak dimaksudkan untuk menjadi, dan tidak membentuk, nasihat untuk kewangan, pelaburan, perdagangan dan jenis-jenis lain atau cadangan yang dibekalkan atau disahkan oleh TradingView. Baca dengan lebih lanjut di Terma Penggunaan.
Penafian
Maklumat dan penerbitan adalah tidak dimaksudkan untuk menjadi, dan tidak membentuk, nasihat untuk kewangan, pelaburan, perdagangan dan jenis-jenis lain atau cadangan yang dibekalkan atau disahkan oleh TradingView. Baca dengan lebih lanjut di Terma Penggunaan.