24th June 2025/ 9:40
Why PFC?
1. Fundamentally Good Company + Regular Dividend Payouts.
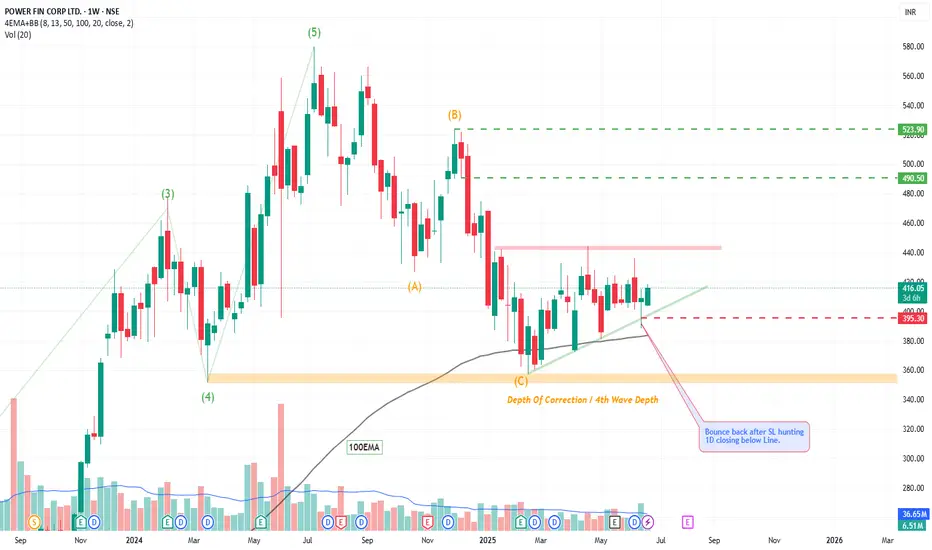
2. Technically, Feb 2025 low depth was equals to impulse Wave 4, which shows correction got its full depth from wave theory perspective.
3. After Depth of Correction, it gave fake sell entry from 100EMA also and bounce back in Feb- Mar 2025 and sustaining above 100EMA currently.
4. Recently price action was making some sort of sideways pattern Flag or Triangle but most imp. is that I have noticed in mid-June in 1D TF it gave closing below support zone and from next day it enters back above the zone. which denotes SL hunted and Sellers got fake entry.
Note: Market do shakeout before breakout just to shake early investors and to hit SL of Breakout Traders. Can happens both sides Buy and Sell.
SL & Targets are mentioned!!
Why PFC?
1. Fundamentally Good Company + Regular Dividend Payouts.
2. Technically, Feb 2025 low depth was equals to impulse Wave 4, which shows correction got its full depth from wave theory perspective.
3. After Depth of Correction, it gave fake sell entry from 100EMA also and bounce back in Feb- Mar 2025 and sustaining above 100EMA currently.
4. Recently price action was making some sort of sideways pattern Flag or Triangle but most imp. is that I have noticed in mid-June in 1D TF it gave closing below support zone and from next day it enters back above the zone. which denotes SL hunted and Sellers got fake entry.
Note: Market do shakeout before breakout just to shake early investors and to hit SL of Breakout Traders. Can happens both sides Buy and Sell.
SL & Targets are mentioned!!
Dagangan aktif
This Weekly & Monthly Closing Below SL & I'll Close this one.Dagangan ditutup: hentian tercapai
Penafian
Maklumat dan penerbitan adalah tidak bertujuan, dan tidak membentuk, nasihat atau cadangan kewangan, pelaburan, dagangan atau jenis lain yang diberikan atau disahkan oleh TradingView. Baca lebih dalam Terma Penggunaan.
Penafian
Maklumat dan penerbitan adalah tidak bertujuan, dan tidak membentuk, nasihat atau cadangan kewangan, pelaburan, dagangan atau jenis lain yang diberikan atau disahkan oleh TradingView. Baca lebih dalam Terma Penggunaan.