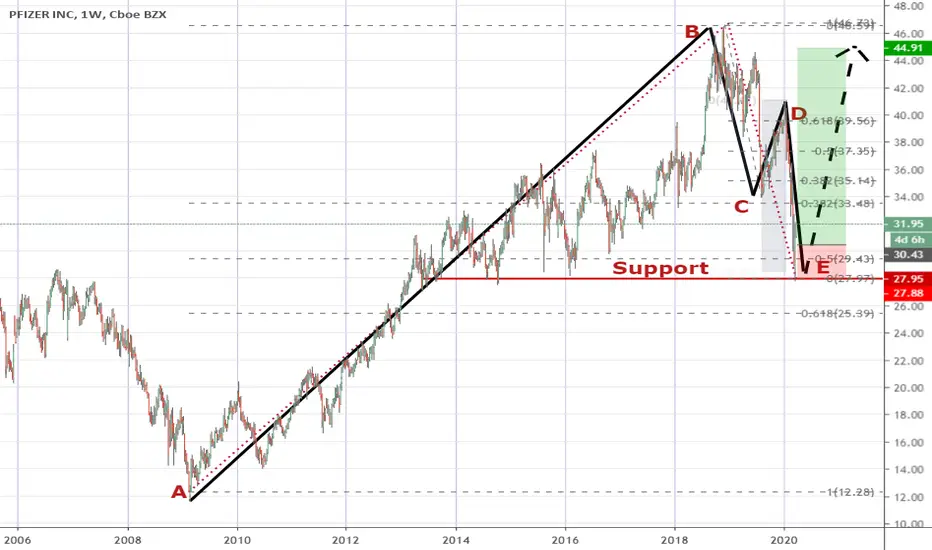
I am excited to see a bullish fibonacci 2-step pattern on PFE's weekly chart!
A bullish 2-step pattern will form a lower high and a lower low after a prior uptrend but despite this, it is not the begining of a bigger downtrend but instead the odds are good that the uptrend then resumes from here. The 2 step pattern (forming a lower high and then a lower low) has to conform to certain fibonacci ratios in order to be valid (google "fibonacci 2-step pattern) if u want to learn more about this pattern). For this PFE chart, BC = DE (100% projection), and CD = 50% retracement of BC.
I am going long with the assumption that the bigger up swing is now resuming although I will still be managing my positions up by scaling out incremetally on the way up.
Disclaimer: This is just my own analysis and opinion for discussion and is not a trade advice. Kindly do your own due diligence and trade according to your own risk tolerance. Thank you!
Penafian
Maklumat dan penerbitan adalah tidak dimaksudkan untuk menjadi, dan tidak membentuk, nasihat untuk kewangan, pelaburan, perdagangan dan jenis-jenis lain atau cadangan yang dibekalkan atau disahkan oleh TradingView. Baca dengan lebih lanjut di Terma Penggunaan.
Penafian
Maklumat dan penerbitan adalah tidak dimaksudkan untuk menjadi, dan tidak membentuk, nasihat untuk kewangan, pelaburan, perdagangan dan jenis-jenis lain atau cadangan yang dibekalkan atau disahkan oleh TradingView. Baca dengan lebih lanjut di Terma Penggunaan.
