Today, we will use the Daily chart to understand Bullish and Bearish directions on this stock
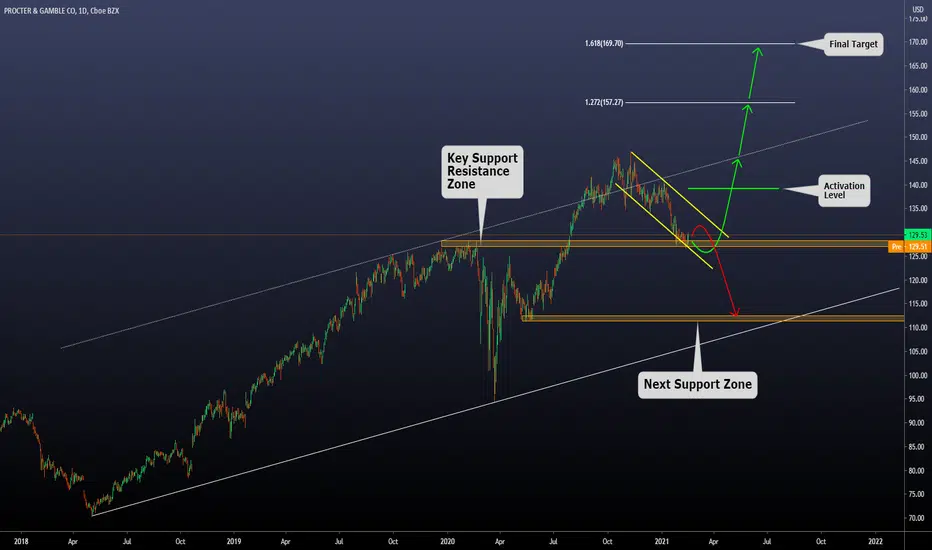
a) Currently, the price is on a Key Support/Resistance zone, and we can expect a bounce or a breakout
b) If we have a breakout of the current level, the next level we can find support is 112 - 110
c) If the price bounces on the support zone, we have 3 levels to pay attention to and a final target on 170
d) In case we have a bearish breakout, we will wait for the price to reach the next support zone before developing new setups.
e) In case we have a bounce on the current level, we will wait for a bullish breakout of the current flag pattern, and we will use the green line as the activation level. Final target on 170 / Stop loss below the Flag Pattern
Thanks for reading!
Penafian
Maklumat dan penerbitan adalah tidak dimaksudkan untuk menjadi, dan tidak membentuk, nasihat untuk kewangan, pelaburan, perdagangan dan jenis-jenis lain atau cadangan yang dibekalkan atau disahkan oleh TradingView. Baca dengan lebih lanjut di Terma Penggunaan.
Penafian
Maklumat dan penerbitan adalah tidak dimaksudkan untuk menjadi, dan tidak membentuk, nasihat untuk kewangan, pelaburan, perdagangan dan jenis-jenis lain atau cadangan yang dibekalkan atau disahkan oleh TradingView. Baca dengan lebih lanjut di Terma Penggunaan.