📊 Key levels & structure
Based on current weekly chart readings, recent pivot data and visible support/resistance zones:
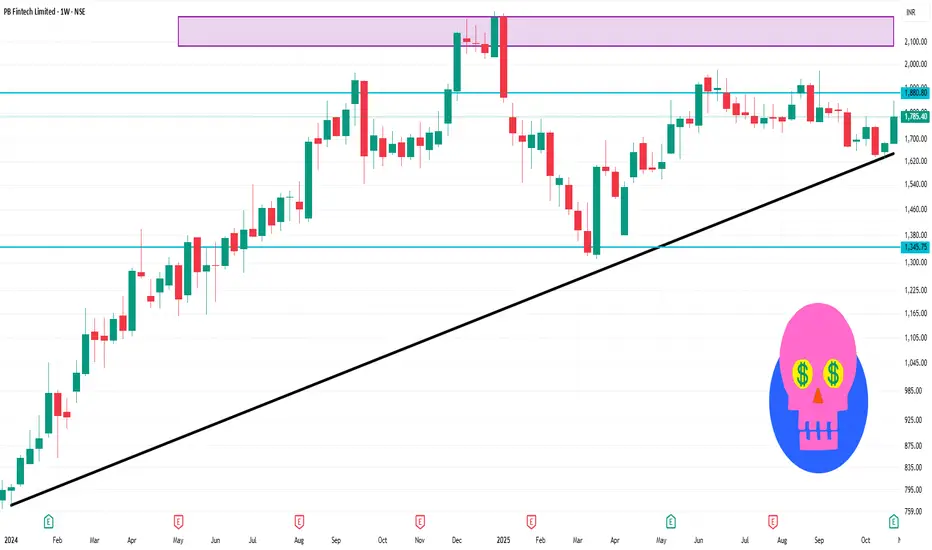
Resistance zone: ~ ₹1,775-1,825 — price has been tested around this area, acting as a cap.
Support zone: ~ ₹1,650-1,620 — key lower bounds that have held in recent pullbacks.
Intermediate pivot / trigger area: ~ ₹1,700-₹1,740 — if this area gives way, next leg down could accelerate; if it holds, potential bounce.
Weekly trend: The stock is below its 50- and 200-week moving averages, signalling caution for bulls.
Momentum: RSI in mid‐range, ADX weak, so trend strength is moderate.
Based on current weekly chart readings, recent pivot data and visible support/resistance zones:
Resistance zone: ~ ₹1,775-1,825 — price has been tested around this area, acting as a cap.
Support zone: ~ ₹1,650-1,620 — key lower bounds that have held in recent pullbacks.
Intermediate pivot / trigger area: ~ ₹1,700-₹1,740 — if this area gives way, next leg down could accelerate; if it holds, potential bounce.
Weekly trend: The stock is below its 50- and 200-week moving averages, signalling caution for bulls.
Momentum: RSI in mid‐range, ADX weak, so trend strength is moderate.
Penerbitan berkaitan
Penafian
Maklumat dan penerbitan adalah tidak bertujuan, dan tidak membentuk, nasihat atau cadangan kewangan, pelaburan, dagangan atau jenis lain yang diberikan atau disahkan oleh TradingView. Baca lebih dalam Terma Penggunaan.
Penerbitan berkaitan
Penafian
Maklumat dan penerbitan adalah tidak bertujuan, dan tidak membentuk, nasihat atau cadangan kewangan, pelaburan, dagangan atau jenis lain yang diberikan atau disahkan oleh TradingView. Baca lebih dalam Terma Penggunaan.