📈 Weekly Technical Outlook
Over the past week, Polycab's stock has demonstrated a strong bullish trend, supported by several key technical indicators:
Technical Ratings: Both daily and weekly analyses indicate a "Strong Buy" signal, suggesting sustained upward momentum.
Relative Strength Index (RSI): The weekly RSI stands at 85.19, indicating the stock is in overbought territory, which may suggest a potential short-term pullback.
Support and Resistance Levels:
Immediate Support: ₹7,193
Immediate Resistance: ₹7,890
Medium-Term Resistance: ₹8,693.86
Long-Term Resistance: ₹9,068.70
Long-Term Support: ₹6,000.50
Trend Indicators: Moving averages and other technical indicators are aligned with a bullish trend, supporting the "Strong Buy" signal.
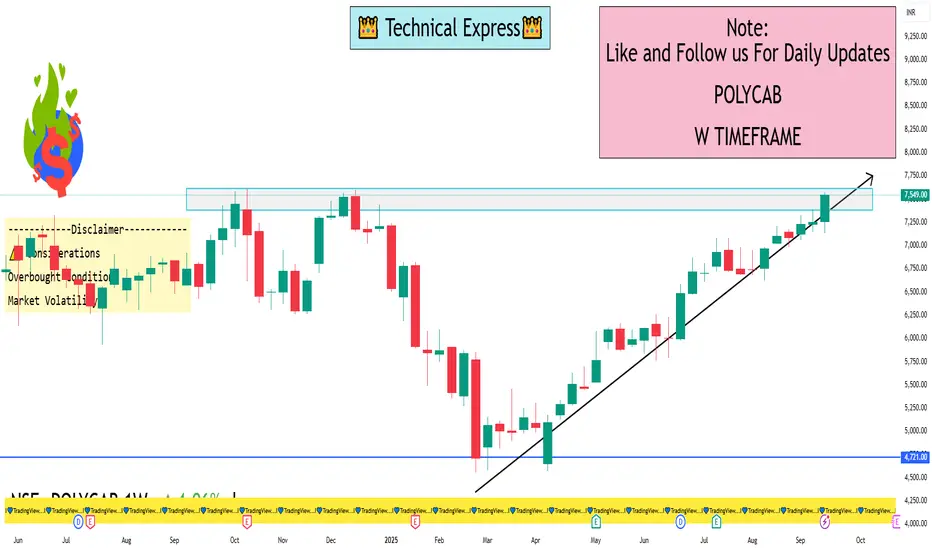
⚠️ Considerations
Overbought Conditions: The high RSI suggests the stock may be due for a short-term consolidation or pullback.
Market Volatility: Investors should be aware of potential market fluctuations that could impact stock performance.
📊 Summary
Polycab India Ltd. is exhibiting strong bullish momentum on the weekly timeframe. While the stock's overbought condition warrants caution, the overall technical indicators support a positive outlook. Investors should monitor key support and resistance levels and consider potential short-term corrections as part of their investment strategy.
Over the past week, Polycab's stock has demonstrated a strong bullish trend, supported by several key technical indicators:
Technical Ratings: Both daily and weekly analyses indicate a "Strong Buy" signal, suggesting sustained upward momentum.
Relative Strength Index (RSI): The weekly RSI stands at 85.19, indicating the stock is in overbought territory, which may suggest a potential short-term pullback.
Support and Resistance Levels:
Immediate Support: ₹7,193
Immediate Resistance: ₹7,890
Medium-Term Resistance: ₹8,693.86
Long-Term Resistance: ₹9,068.70
Long-Term Support: ₹6,000.50
Trend Indicators: Moving averages and other technical indicators are aligned with a bullish trend, supporting the "Strong Buy" signal.
⚠️ Considerations
Overbought Conditions: The high RSI suggests the stock may be due for a short-term consolidation or pullback.
Market Volatility: Investors should be aware of potential market fluctuations that could impact stock performance.
📊 Summary
Polycab India Ltd. is exhibiting strong bullish momentum on the weekly timeframe. While the stock's overbought condition warrants caution, the overall technical indicators support a positive outlook. Investors should monitor key support and resistance levels and consider potential short-term corrections as part of their investment strategy.
I built a Buy & Sell Signal Indicator with 85% accuracy.
📈 Get access via DM or
WhatsApp: wa.link/d997q0
Contact - +91 76782 40962
| Email: techncialexpress@gmail.com
| Script Coder | Trader | Investor | From India
📈 Get access via DM or
WhatsApp: wa.link/d997q0
Contact - +91 76782 40962
| Email: techncialexpress@gmail.com
| Script Coder | Trader | Investor | From India
Penerbitan berkaitan
Penafian
The information and publications are not meant to be, and do not constitute, financial, investment, trading, or other types of advice or recommendations supplied or endorsed by TradingView. Read more in the Terms of Use.