Symmetrical triangle = compression where buyers keep stepping in higher, but sellers cap at lower levels
In a proper symmetrical triangle, volume should decline as the pattern compresses
Volume must expand; otherwise it’s just a fake-out; ideally, RSI also breaks under ~40 & MACD diverges down
Watch the first 15–30 min of volume after the break
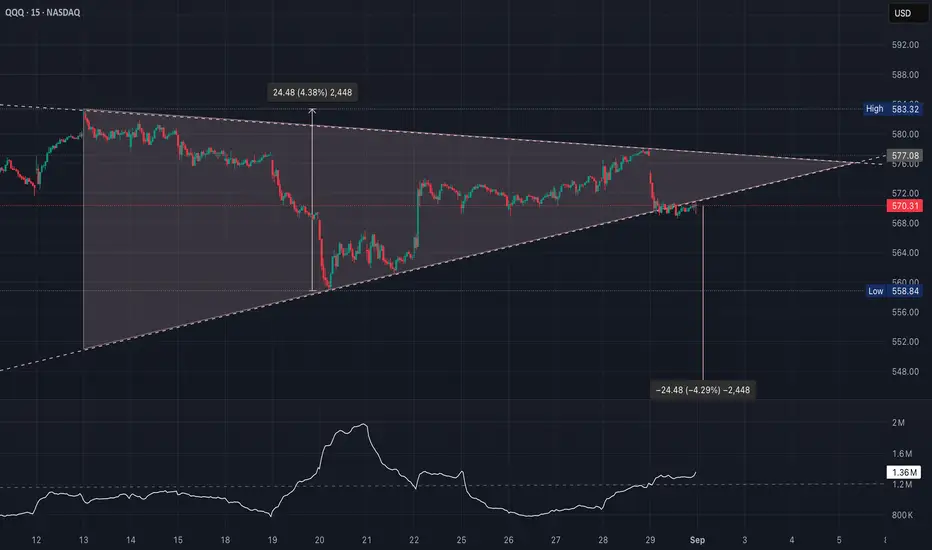
Price broke down through the ascending support trendline around ~$572, currently testing $570
Bulls need a fast reclaim of $572–$573 on strong volume; otherwise, bears keep control
- Often a continuation pattern, but it can break either way depending on volume + macro drivers
- MACD just had a bearish cross earlier, but it’s trying to curl back up which suggests indecision & matches the triangle
- RSI is holding mid-zone (~45) - not oversold, not overbought, again, neutral compression
In a proper symmetrical triangle, volume should decline as the pattern compresses
- This shows traders waiting, fewer willing to commit inside the chop
- That looks normal here (quieter trading into late August)
Volume must expand; otherwise it’s just a fake-out; ideally, RSI also breaks under ~40 & MACD diverges down
- If price falls back inside the triangle on weak volume, it’s a false move
- If price reclaims the ascending line quickly, it’s a bear trap
- If the breakout candle volume is ≥150% of average, that’s confirmation
- If price moves but volume stays weak, expect a possible reversal
Watch the first 15–30 min of volume after the break
- If it’s a strong surge, odds favor continuation
- If volume fades and price chops back inside the triangle, it’s likely a fake-out
Price broke down through the ascending support trendline around ~$572, currently testing $570
- Volume expanded on the breakdown candle which adds credibility to the move
- If follow-through comes with continued above-average volume, it confirms the downside break
- Triangle height is ~24 points (from ~$583 high to ~$559 low), so $570 – $24 = ~$546 (aligns with prior support from mid-August)
- If volume continues to stay above 1.3M baseline & Tuesday closes weak, expect sellers to aim for ~$558 first (previous swing low) & then the measured move (~$546)
- Direction = which line breaks (up/down)
- Strength = whether volume surges beyond normal
Bulls need a fast reclaim of $572–$573 on strong volume; otherwise, bears keep control
I am not a licensed professional & these posts are for informational purposes only, not financial advice.
Penafian
Maklumat dan penerbitan adalah tidak bertujuan, dan tidak membentuk, nasihat atau cadangan kewangan, pelaburan, dagangan atau jenis lain yang diberikan atau disahkan oleh TradingView. Baca lebih dalam Terma Penggunaan.