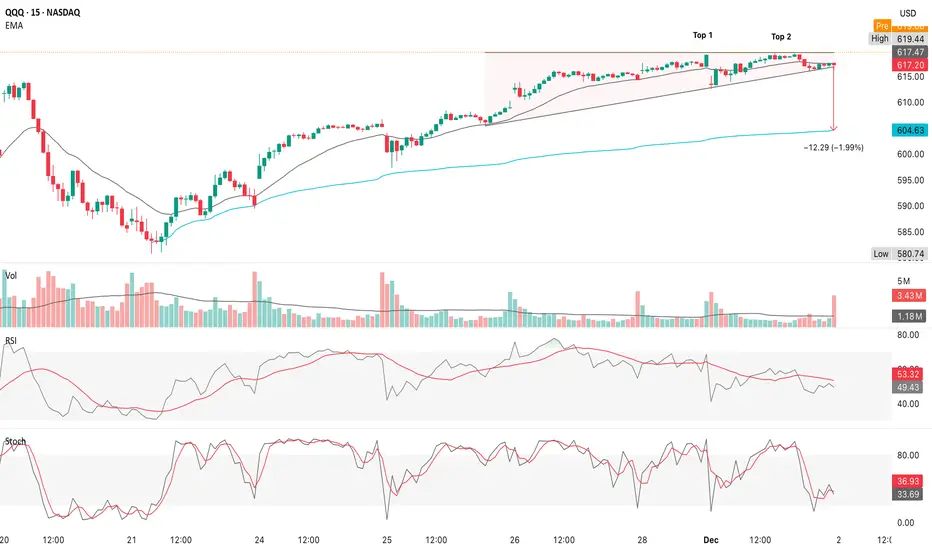
The 15m chart shows 3 things with absolute clarity
1. Rising wedge
• A clean candle through wedge support
• A retest attempt that failed
• Follow-through selling
• High-volume breakdown bar
2. Double top at $619-$620
• Top 1 rejection
• Top 2 rejection
• Neckline broken
• Pattern validated
• The double top + wedge combo gives strong short-term downside momentum
3. Momentum confirms the breakdown
• RSI sloping down, under its average
• Stoch rolling over from mid zone
• No bullish divergences
• No failed breakdown behavior
• This is genuine intraday weakness
Short-term downtrend on the 15m is active & should continue toward support, ~$604
• This target is not arbitrary - it has extremely strong confluence
• Rising wedge measured move
• Double-top measured move
• AVWAP (21 November) ≈ $603-$605
• Daily pivot support zone
• 50d MA ~$604
• Largest VPVR volume node (HVN) $602-$610
• Fair-value of the entire multi-week range
Every timeframe and every tool points to $604-$610 as the magnet
• The market is heading directly toward it
• This 15m breakdown is simply the path into it
Volume confirms this is real selling
• The breakdown candle has higher volume
• Volume increased from baseline
• Not holiday drift, not thin liquidity
• True supply entered at the top
• This validates the move
Short-term is bearish until ~$604-$610 is hit
• This is a normal pullback into support
The larger trend remains bullish because price is above all major MAs (20d/50d/100d/200d)
• Macro shifted bullish (rate-cut odds jumped)
• Daily trend structure is intact
• 4H MACD still bullish
• Daily RSI still rising
This 15m breakdown is corrective within an uptrend
• Follow-through toward ~$610
• Liquidity sweep of the wedge target ~$604-$606
• Bounce attempt from $604-$610
• The market will try to reclaim $612-$615
• If it succeeds, trend resumes toward $620+
• If it fails → next test is $600-$603
Bullish continuation remains intact above $610, while warning signals appear below $610 & a break of $605
• Both still compatible with larger bullish structure
Bearish shift (deeper correction risk)
• Break below $600
• Bearish confirmation with a break below $590
• This would signal a structural break on the daily timeframe; however, right now we are nowhere near those lower levels
The 15m chart shows a real, clean breakdown, valid bearish patterns, selling into the highs & momentum rolling over
• A short-term move toward ~$604-$610, but this is a normal pullback in a strong daily uptrend & larger trend remains bullish
• $604-$610 is key
• Expect a bounce attempt there
• No evidence yet of a trend reversal
• No evidence of a larger correction unless $600, then $590 break
• This is exactly how strong markets correct
I am not a licensed professional & these posts are for informational purposes only, not financial advice.
Penafian
Maklumat dan penerbitan adalah tidak bertujuan, dan tidak membentuk, nasihat atau cadangan kewangan, pelaburan, dagangan atau jenis lain yang diberikan atau disahkan oleh TradingView. Baca lebih dalam Terma Penggunaan.