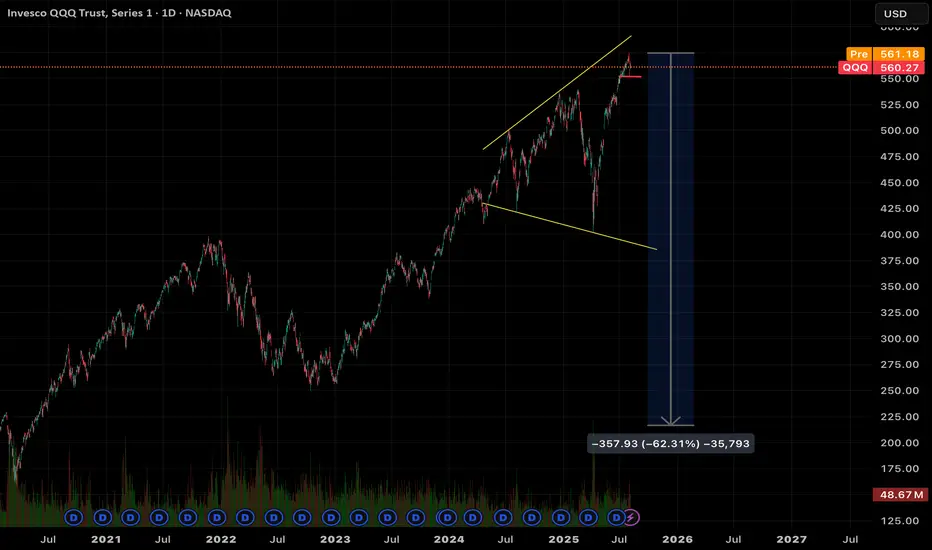
Broadening top seen, with current PO if the recent high is the top. There’s still room to run higher to test the upper boundary of this pattern. Should the current potential head and shoulders top on the hourly chart break out to the downside then the odds of the top being in now increases.
The same head and shoulders pattern is showing up in the major averages and also for Berkshire Hathaway.
The same head and shoulders pattern is showing up in the major averages and also for Berkshire Hathaway.
Penafian
Maklumat dan penerbitan adalah tidak dimaksudkan untuk menjadi, dan tidak membentuk, nasihat untuk kewangan, pelaburan, perdagangan dan jenis-jenis lain atau cadangan yang dibekalkan atau disahkan oleh TradingView. Baca dengan lebih lanjut di Terma Penggunaan.
Penafian
Maklumat dan penerbitan adalah tidak dimaksudkan untuk menjadi, dan tidak membentuk, nasihat untuk kewangan, pelaburan, perdagangan dan jenis-jenis lain atau cadangan yang dibekalkan atau disahkan oleh TradingView. Baca dengan lebih lanjut di Terma Penggunaan.
