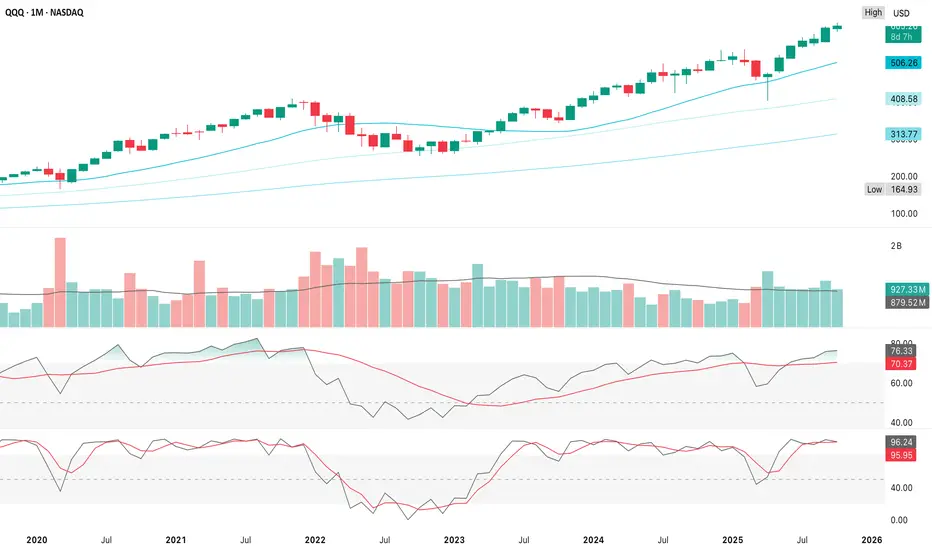
The monthly candles show a secular uptrend
The long-term “fuel” is still there, but risk-reward for new longer-term entries is thinning, so a multi-month consolidation or modest correction wouldn’t be unusual
Volume has drifted lower since 2022, which hints that participation has narrowed to the mega-caps
1. Continued grind higher
2. Healthy correction
3. Trend failure
The monthly chart shows QQQ in a mature but intact bull trend with momentum hot, volume thinning, room for a 5-10% reset without real technical damage
Feb-Mar 2020
Nov 2021-Jan 2022
Aug 2023-Oct 2023
Apr 2024-May 2024
-5% to -8% lasting 1-2 months while the long-term uptrend stays intact
1. RSI divergence on the weekly chart (lower high while price makes a higher high)
2. RSI falls back toward 60-65 on the monthly
🧭 Summary
Historical overbought phases in QQQ resolve with a –5% to –8% dip over 1-2 months,
usually bottoming around $560-$575, then resuming the larger bull trend
- Price remains well above the 20, 50 & 100 month moving averages
- Even with the short-term volatility we’ve seen around $603-$613, that’s just noise inside a steep upward channel
- Big-picture momentum is still firmly bullish
- Intraday price range are temporary mean-reversions inside an ongoing trend
The long-term “fuel” is still there, but risk-reward for new longer-term entries is thinning, so a multi-month consolidation or modest correction wouldn’t be unusual
- RSI ≈ 76 is solidly overbought, but not diverging yet - typical of strong late-cycle trends
- When RSI stays above 70 for months, it signals strength, not necessarily exhaustion
- Stochastic ≈ 96 is extremely stretched which is often where monthly pullbacks (5–10%) - it can stay pinned for months before reversing
Volume has drifted lower since 2022, which hints that participation has narrowed to the mega-caps
- That aligns with what we’re seeing day-to-day with QQQE (equal-weight) lagging, concentrated leadership from the largest names
1. Continued grind higher
- If earnings/CPI stay supportive, QQQ could extend toward $630-$640 before serious resistance - hold above $600
2. Healthy correction
- A 5-8% dip to $570-$580 would reset momentum without breaking trend
- Support at 20 month MA (~$505) if deeper
3. Trend failure
- Only a sustained break below $500-$505 would turn the monthly chart bearish
- 100 month MA near $314 = long-term floor
The monthly chart shows QQQ in a mature but intact bull trend with momentum hot, volume thinning, room for a 5-10% reset without real technical damage
- For day-to-day trading, expect more mean-reversion around $600-$620 until volatility events pass
- Long bias remains justified while price is above the 20 month MA
- Intraday fades & pullbacks are tactical only - they’re counter-trend, not trend reversals
- Watch IV + macro catalysts since spikes in implied volatility (earnings/CPI) often create those short-term pullbacks without changing the monthly structure
Feb-Mar 2020
- RSI > 75
- Stoch > 95
- –12 %
- 1 month COVID crash (black-swan, outsized)
Nov 2021-Jan 2022
- RSI ≈ 77
- Stoch ≈ 96
- –10 %
- 2 months
- Rate-hike scare, peak valuation
Aug 2023-Oct 2023
- RSI ≈ 74
- Stoch ≈ 94
- –7 %
- 2 months
- Bond-yield spike/earnings reset
Apr 2024-May 2024
- RSI ≈ 76
- Stoch ≈ 97
- –6 %
- 1 month
- Macro pause, then continuation
-5% to -8% lasting 1-2 months while the long-term uptrend stays intact
- Current price ≈ $604
- –5 % ≈ $573
- Minor swing-low support (Aug 2024 area)
- –7 % ≈ $562
- Volume-weighted support/10 month MA
- –10 % ≈ $543
- 2024 high retest, deeper but still trend-safe
- That $560-$575 area would relieve monthly overbought conditions without threatening the secular trend
1. RSI divergence on the weekly chart (lower high while price makes a higher high)
- Weekly close below $600 confirms cooling momentum
- VXN (Nasdaq Volatility Index) >20 shows volatility expansion accompanying the fade
- Volume expansion on red candles after CPI/Fed events
2. RSI falls back toward 60-65 on the monthly
- Price stabilizes near the 20 week or 50d MA (roughly $575-$585)
- IV compresses again in a new accumulation phase/continuation toward prior highs
🧭 Summary
Historical overbought phases in QQQ resolve with a –5% to –8% dip over 1-2 months,
usually bottoming around $560-$575, then resuming the larger bull trend
- Anything beyond –10 % would signal a regime change rather than a standard reset
I am not a licensed professional & these posts are for informational purposes only, not financial advice
Penafian
Maklumat dan penerbitan adalah tidak dimaksudkan untuk menjadi, dan tidak membentuk, nasihat untuk kewangan, pelaburan, perdagangan dan jenis-jenis lain atau cadangan yang dibekalkan atau disahkan oleh TradingView. Baca dengan lebih lanjut di Terma Penggunaan.