QQQ Gamma Map & Playbook (May 12, 2025)
General Context:
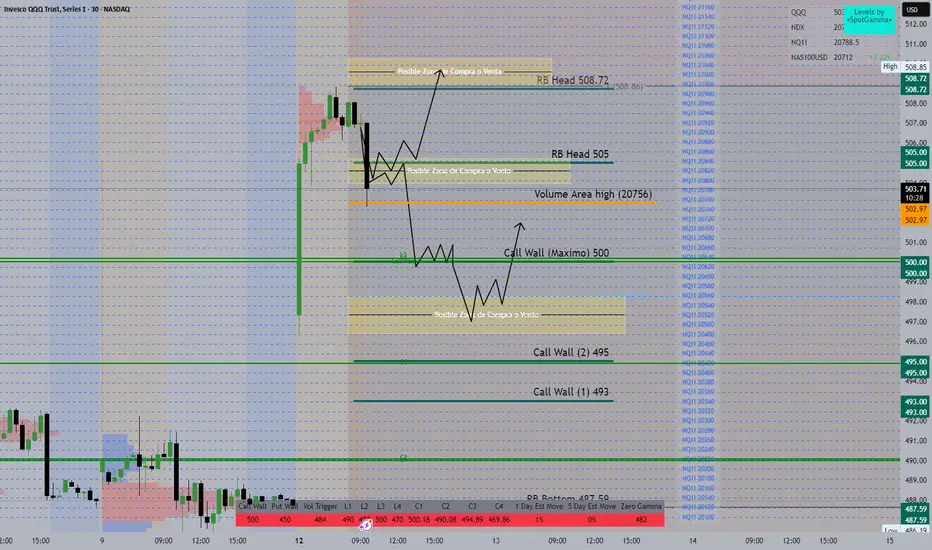
The chart is showing a post-gap continuation with early selling pressure.
Gamma exposure zones are defined with Call Walls, Resistance Bands (RB), and Volume Area levels.
This setup helps identify key decision zones for both long and short plays.
🔑 Key Gamma Levels (as per SpotGamma):
Level Type Price Commentary
Zero Gamma 482 Below this level, volatility likely increases.
Vol Trigger 484 Risk-on above this line.
Put Wall 450 Major downside protection.
Call Wall (Max) 500 Magnet level for market makers.
RB Head 508 / 505 Resistance Bands: potential short zones.
RB Bottom 487.59 Major support if price collapses.
Volume Area High 20756 Key volume resistance from futures.
📈 Scenarios Projected on Chart:
🅰️ Bullish Scenario
Bounce from 500 → Consolidation → Breakout through 505 → Target: RB Head 508.72
This move would likely trap shorts near 500 and push toward high gamma area.
🅱️ Bearish Scenario
Failure to hold 500 → Drop to 495-493 → Bounce attempt.
If weak, price may test the yellow box zone (Possible buy/sell area) near RB Bottom
General Context:
The chart is showing a post-gap continuation with early selling pressure.
Gamma exposure zones are defined with Call Walls, Resistance Bands (RB), and Volume Area levels.
This setup helps identify key decision zones for both long and short plays.
🔑 Key Gamma Levels (as per SpotGamma):
Level Type Price Commentary
Zero Gamma 482 Below this level, volatility likely increases.
Vol Trigger 484 Risk-on above this line.
Put Wall 450 Major downside protection.
Call Wall (Max) 500 Magnet level for market makers.
RB Head 508 / 505 Resistance Bands: potential short zones.
RB Bottom 487.59 Major support if price collapses.
Volume Area High 20756 Key volume resistance from futures.
📈 Scenarios Projected on Chart:
🅰️ Bullish Scenario
Bounce from 500 → Consolidation → Breakout through 505 → Target: RB Head 508.72
This move would likely trap shorts near 500 and push toward high gamma area.
🅱️ Bearish Scenario
Failure to hold 500 → Drop to 495-493 → Bounce attempt.
If weak, price may test the yellow box zone (Possible buy/sell area) near RB Bottom
Penafian
Maklumat dan penerbitan adalah tidak dimaksudkan untuk menjadi, dan tidak membentuk, nasihat untuk kewangan, pelaburan, perdagangan dan jenis-jenis lain atau cadangan yang dibekalkan atau disahkan oleh TradingView. Baca dengan lebih lanjut di Terma Penggunaan.
Penafian
Maklumat dan penerbitan adalah tidak dimaksudkan untuk menjadi, dan tidak membentuk, nasihat untuk kewangan, pelaburan, perdagangan dan jenis-jenis lain atau cadangan yang dibekalkan atau disahkan oleh TradingView. Baca dengan lebih lanjut di Terma Penggunaan.