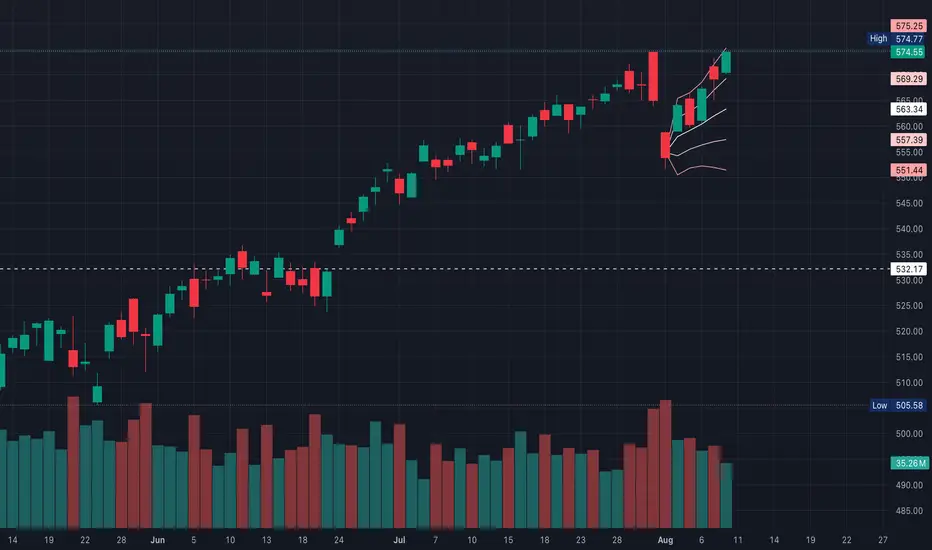
QQQ appears like it’s entering a make or break moment where breakouts above resistance run fast, but a failure often leads to a retest of recent support levels
Chart shows a bullish engulfing continuation pattern
QQQ is at a prime reversal risk area
So while the default bias is still up until support breaks, QQQ is at the inflection point where,
Some possible reversal levels on QQQ based on the chart
Some possible confirmation signals
* [I]I am not a licensed professional & these posts are for informational purposes only, not financial advice
- Trend is still bullish with price above all short-term MAs, 5d EMA ($569.29) & 10d EMA ($563.34) as support
- Volume is lower than the earlier push, which might suggest the rally is running on lighter participation or profit-taking
- Immediate resistance is $575.25 so a break above with volume could trigger continuation toward $580
- Support levels at $569.29, then $563.34, with stronger support around $557.39
Chart shows a bullish engulfing continuation pattern
- The green candle’s body fully engulfs the prior small red candle’s body
- It appears after a short pullback inside an overall uptrend
- This is a continuation signal, not a reversal, since the trend was already bullish before it appeared
QQQ is at a prime reversal risk area
- Price is testing resistance ($575.25) after multiple green closes (extended moves into resistance often attract profit-taking)
- Volume is lighter on this push than earlier in the rally, showing less conviction
- Price is several points above the 5d EMA ($569.29), so mean reversion risk is higher given short-term overextension
- If Monday opens higher, but fails to break $575.25 & closes red, that would print a potential shooting star/hanging man depending on wick length, both bearish signs
So while the default bias is still up until support breaks, QQQ is at the inflection point where,
- Break above $575.25 with strong volume, then a possible continuation higher
- Failure & close under $569, then short-term reversal lower may play out
Some possible reversal levels on QQQ based on the chart
- $575.25 - if price breaks above, but quickly rejects & falls back under this level on high selling volume, it’s a bull trap signal
- $572.00 - a break below this with momentum increases reversal odds
- A close below $569.29 (5d EMA) after Friday’s breakout attempt may be the first technical sign of reversal
- The 10d EMA of $563.34 is the prior pivot low, so a close lower could possibly confirm a short-term trend shift
Some possible confirmation signals
- Big upper wick near highs & red close on Monday may suggest a bearish candlestick confirmation
- Spike in volume on a red candle may suggest that institutions are distributing at the top
- RSI rolling over from overbought levels
- If Monday opens strong, but stalls near $575.25, suggests a high-probability day trade short for a pullback to $569-$570
- If price gaps above $575.25 & holds, the reversal risk is lower until at least $580
* [I]I am not a licensed professional & these posts are for informational purposes only, not financial advice
I am not a licensed professional & these posts are for informational purposes only, not financial advice
Penafian
Maklumat dan penerbitan adalah tidak dimaksudkan untuk menjadi, dan tidak membentuk, nasihat untuk kewangan, pelaburan, perdagangan dan jenis-jenis lain atau cadangan yang dibekalkan atau disahkan oleh TradingView. Baca dengan lebih lanjut di Terma Penggunaan.