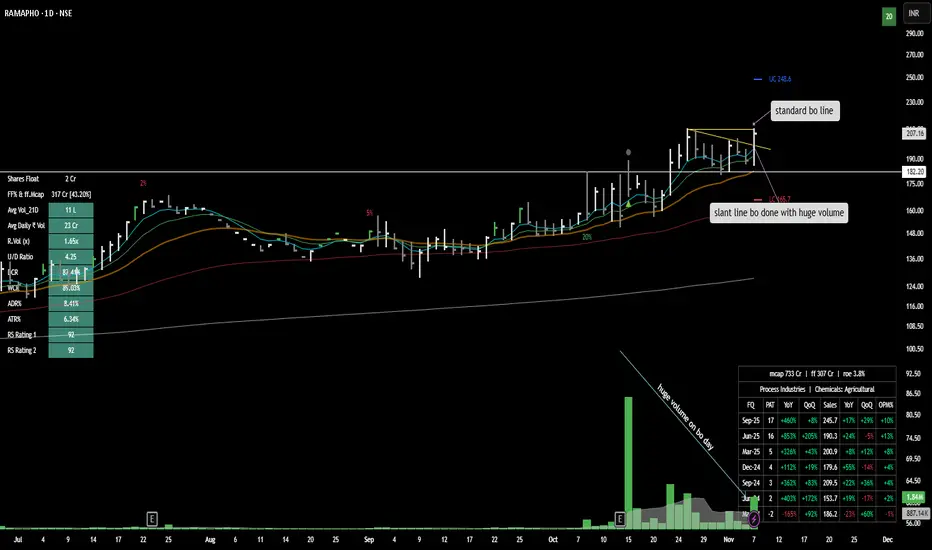
1. Breakout Confirmation With Huge Volume
The chart highlights a slant line breakout accompanied by exceptionally high volume, signaling strong market participation and increased buying interest on the breakout day.
2. Standard Breakout Line Resistance
A standard breakout line is marked, showing price action tested and subsequently surpassed this resistance, confirming a bullish setup.
3. Strong Up/Down Ratio and Relative Strength
The U/D (Up/Down) ratio is 4.25 and RS Rating is 92, indicating strong outperformance compared to the market and buying pressure relative to selling.
4. Healthy Float and Liquidity Metrics
Shares float stands at 2 Crore and the free float market cap is 317 Cr, supporting decent liquidity for trading, while the daily average turnover is 23 Cr.
5. Consistent Financial Growth
Quarterly summary boxes show substantial profit and sales growth, with YoY and QoQ improvements in PAT, Sales, and OPM%, highlighting healthy fundamentals.
6. Technical Breadth And Momentum
The stock maintains high CCI (87) and WCK (85%), and is above key moving averages, while ADR (8.41%) and ATR (6.34%) signal strong price volatility and ongoing momentum.
Penafian
Maklumat dan penerbitan adalah tidak bertujuan, dan tidak membentuk, nasihat atau cadangan kewangan, pelaburan, dagangan atau jenis lain yang diberikan atau disahkan oleh TradingView. Baca lebih dalam Terma Penggunaan.
Penafian
Maklumat dan penerbitan adalah tidak bertujuan, dan tidak membentuk, nasihat atau cadangan kewangan, pelaburan, dagangan atau jenis lain yang diberikan atau disahkan oleh TradingView. Baca lebih dalam Terma Penggunaan.