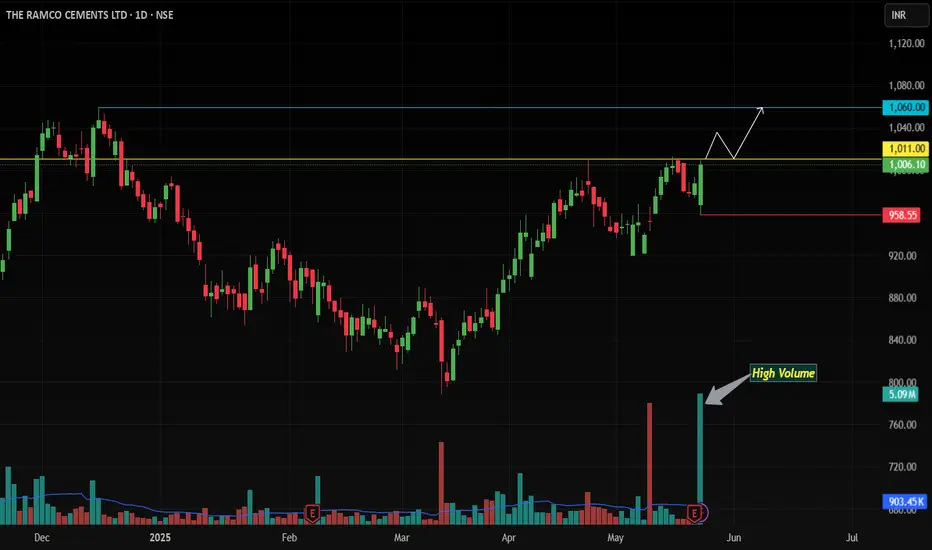
Analysis Timeframe: Daily Chart | Instrument: The Ramco Cements Ltd (NSE: RAMCOCEM, BSE: RAMCOCEM)
Current Price: Near 1011-1015 | Key Levels: Resistance Zone (1011-1015), Support: 958 (Trailing SL)
🔍 Technical Setup Overview
Ramco Cements (NSE: RAMCOCEM) is flashing a high-conviction bullish reversal pattern on the daily chart, backed by surge in volume and multi-indicator confirmations:
Bullish Engulfing Candle 🕯️🔥
Today’s price action formed a Bullish Engulfing pattern, with the current candle fully swallowing the prior candle. This signals a strong shift in control from sellers to buyers, especially on extremely high volume (institutional accumulation).
EMA Alignment & Dynamic Support
Price rebounded sharply from the 20 EMA and sustains above the 50 EMA and 200 EMA, confirming the broader uptrend’s strength.
Resistance Breakout Potential
The 1011-1015 zone is a critical supply area. A daily close above 1015 would confirm the breakout, opening the path for a rally.
Momentum Confirmation
MACD: Bullish crossover
RSI: Crossed above, signaling bullish momentum acceleration.
🎯 Trade Strategy
Entry Trigger:
Go Long on Daily Close Above 1015
Targets:
First Target: 1060.
Trailing SL Strategy: After 1060, trail SL to the prior daily candle’s low. Exit only on a daily close below the trailing level.
Risk Management:
Initial Stop Loss: 958 (Today’s low, aligns with Bullish Engulfing pattern validity).
Risk-Reward Ratio: 1:2+ (Optimal for swing trades).
📉 Why This Works
Pattern Power: Bullish Engulfing + volume surge = high-probability reversal signal.
Trend Confirmation: Price above all key EMAs + breakout alignment.
Trailing SL: Locks profits while allowing for extended upside in a trending market.
🛡️ Key Risks
False Breakout: Failure to close above 1015 could trap bulls.
Market Sentiment Shift: Broader volatility may disrupt momentum.
Disclaimer: Trading involves risk. This is not financial advice. Verify setups independently.
#NSE #BSE #Breakout #BullishEngulfing #TechnicalAnalysis #RAMCOCEM #StockMarket
SMASH THAT BOOST BUTTON if you’re bullish! 🚀 Follow for more high-probability setups!
Penafian
Maklumat dan penerbitan adalah tidak dimaksudkan untuk menjadi, dan tidak membentuk, nasihat untuk kewangan, pelaburan, perdagangan dan jenis-jenis lain atau cadangan yang dibekalkan atau disahkan oleh TradingView. Baca dengan lebih lanjut di Terma Penggunaan.
Penafian
Maklumat dan penerbitan adalah tidak dimaksudkan untuk menjadi, dan tidak membentuk, nasihat untuk kewangan, pelaburan, perdagangan dan jenis-jenis lain atau cadangan yang dibekalkan atau disahkan oleh TradingView. Baca dengan lebih lanjut di Terma Penggunaan.
