As of the close on Monday, May 19, 2025, Reliance Industries Ltd (NSE: RELIANCE) traded at ₹1,440.80, reflecting a 1.07% decrease from the previous session.
📊 Daily Technical Overview
Price Action:
Opening Price: ₹1,452.10
Day's Range: ₹1,438.20 – ₹1,454.60
52-Week Range: ₹1,114.85 – ₹1,608.80
Volume: Approximately 6.2 million shares traded, below the 50-day average of 8.4 million, indicating reduced market activity.
Technical Indicators:
Relative Strength Index (RSI): 69.84 – approaching overbought territory, suggesting caution.
Moving Average Convergence Divergence (MACD): Bullish crossover, indicating potential upward momentum.
Stochastic Oscillator: 76.17 – in the overbought zone, which may precede a price correction.
Average Directional Index (ADX): Indicates a strong trend, supporting the current price movement.
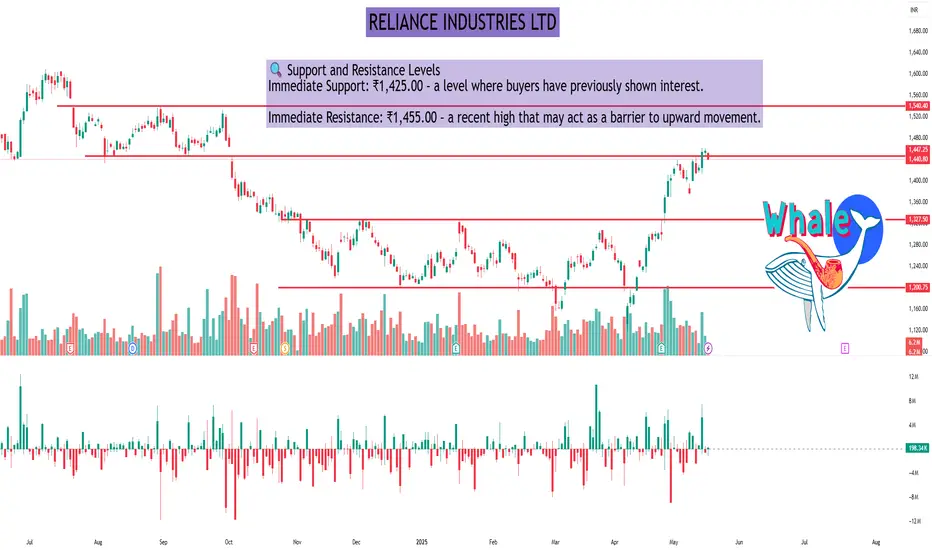
🔍 Support and Resistance Levels
Immediate Support: ₹1,425.00 – a level where buyers have previously shown interest.
Immediate Resistance: ₹1,455.00 – a recent high that may act as a barrier to upward movement.
🔭 Outlook
The technical indicators suggest that Reliance Industries Ltd is experiencing a strong bullish trend. However, the RSI and Stochastic Oscillator indicate that the stock is nearing overbought conditions, which could lead to a short-term consolidation or minor correction. Investors should monitor the support and resistance levels closely and consider the reduced trading volume, which may affect the strength of the current trend.
📊 Daily Technical Overview
Price Action:
Opening Price: ₹1,452.10
Day's Range: ₹1,438.20 – ₹1,454.60
52-Week Range: ₹1,114.85 – ₹1,608.80
Volume: Approximately 6.2 million shares traded, below the 50-day average of 8.4 million, indicating reduced market activity.
Technical Indicators:
Relative Strength Index (RSI): 69.84 – approaching overbought territory, suggesting caution.
Moving Average Convergence Divergence (MACD): Bullish crossover, indicating potential upward momentum.
Stochastic Oscillator: 76.17 – in the overbought zone, which may precede a price correction.
Average Directional Index (ADX): Indicates a strong trend, supporting the current price movement.
🔍 Support and Resistance Levels
Immediate Support: ₹1,425.00 – a level where buyers have previously shown interest.
Immediate Resistance: ₹1,455.00 – a recent high that may act as a barrier to upward movement.
🔭 Outlook
The technical indicators suggest that Reliance Industries Ltd is experiencing a strong bullish trend. However, the RSI and Stochastic Oscillator indicate that the stock is nearing overbought conditions, which could lead to a short-term consolidation or minor correction. Investors should monitor the support and resistance levels closely and consider the reduced trading volume, which may affect the strength of the current trend.
I built a Buy & Sell Signal Indicator with 85% accuracy.
📈 Get access via DM or
WhatsApp: wa.link/d997q0
| Email: techncialexpress@gmail.com
| Script Coder | Trader | Investor | From India
📈 Get access via DM or
WhatsApp: wa.link/d997q0
| Email: techncialexpress@gmail.com
| Script Coder | Trader | Investor | From India
Penerbitan berkaitan
Penafian
Maklumat dan penerbitan adalah tidak dimaksudkan untuk menjadi, dan tidak membentuk, nasihat untuk kewangan, pelaburan, perdagangan dan jenis-jenis lain atau cadangan yang dibekalkan atau disahkan oleh TradingView. Baca dengan lebih lanjut di Terma Penggunaan.